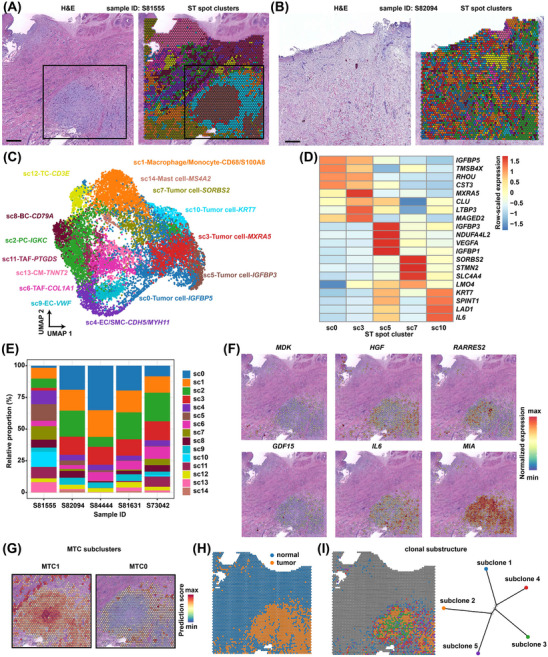
FIGURE 7.

Spatial features of subclusters and clonal evolution of myxoma tumour cells based on spatially resolved transcriptomics. (A) H&E staining (left) and spatial transcriptome (ST) spot cluster distribution (right) for a section of sample S81555. Spots are colour‐coded by spot cluster. Scale bar: 1 mm. The black box indicates a region concentrated with ring‐ or cord‐like tumour cell structures. (B) H&E staining (left) and ST spot cluster distribution (right) for a section of sample S82094. Spots are colour‐coded by spot cluster. Scale bar: 1 mm. (C) The UMAP plot showing the clusters of ST spots of five sections from five patients. Each ST spot cluster was annotated with its major composition cell type. The colour of each cluster is consistent with that used in (A,B). (D) Heatmap showing the expression of the top features for each spot cluster annotated as tumour cells. (E) The relative proportion of each spot cluster in each sample. (F) Spatial distribution of the expression of representative genes encoding proteins secreted by tumour cells. Only the results on the section from sample S81555 are shown. (G) Predicted spatial distribution of MTC subclusters MTC1 and MTC0 on the section of sample S81555. The boxed region in (A) is displayed. The ST and scRNA‐seq data were integrated using the anchor‐based integration workflow of Seurat. (H) Copy number profile inferred by SCEVAN based on the ST data distinguishes tumour from normal cells on the section of sample S81555. (I) Spatial distribution (left) and clonal substructure (right) of subclones inferred by SCEVAN based on ST data on the section of sample S81555. BC, B cell; CM, cardiomyocytes; EC, endothelial cell; PC, plasma cell; SMC, smooth muscle cell; TAF, tumour‐associated fibroblast; TC, T cell; H&E, hematoxylin and eosin; UMAP, Uniform Manifold Approximation and Projection; MTC, MSC‐like tumour cell; scRNA‐seq, single‐cell RNA‐seq.
