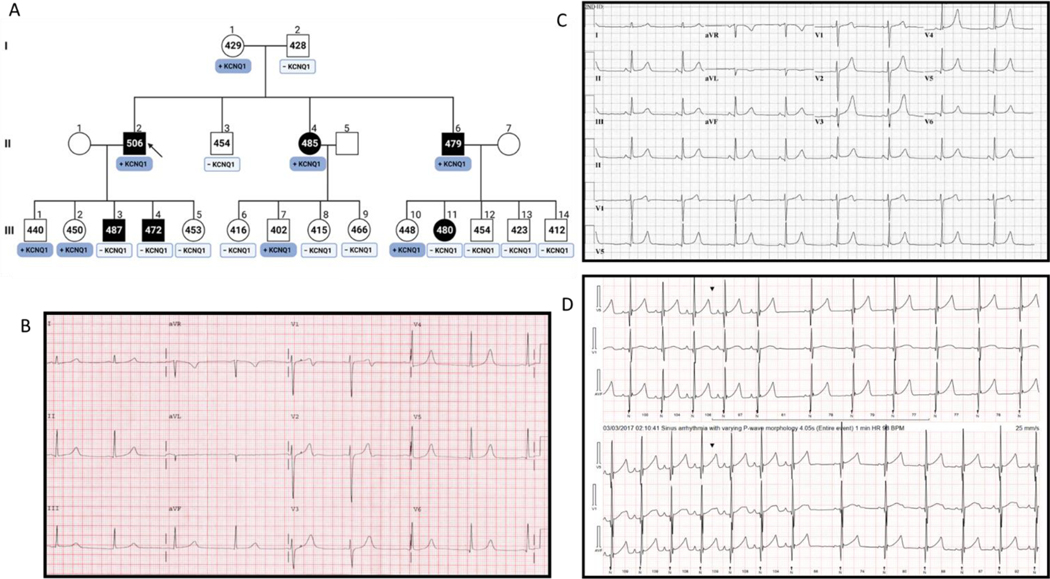
Figure 1 |. A multi-generational pedigree diagnosed with autosomal dominant long QT syndrome.
Shown in panel A is a multi-generation pedigree diagnosed with LQTS. The arrow points to the family index case. Squares represent males, Circles represent females. The black symbols represent family members diagnosed with LQTS based on a prolonged QTc interval. The numbers within the symbols represent the QTc measurements in milliseconds. The boxes under the symbols represent the genotype for family members identified as genotype-positive (dark blue) or genotype-negative (light blue) for the KCNQ1-p.G292D variant identified originally in the index case. Panel B shows a representative ECG tracing for the index case. Panel C is a representative ECG tracing of a family member (1A, II6) demonstrating very tall T waves in the precordial leads and a subtle flattening of the top of the T wave in limb lead III and aVF. Panel D represents Holter traces from a family member (1A, III11) where T waves appear notched and reminiscent of LQT2 like ECG.

