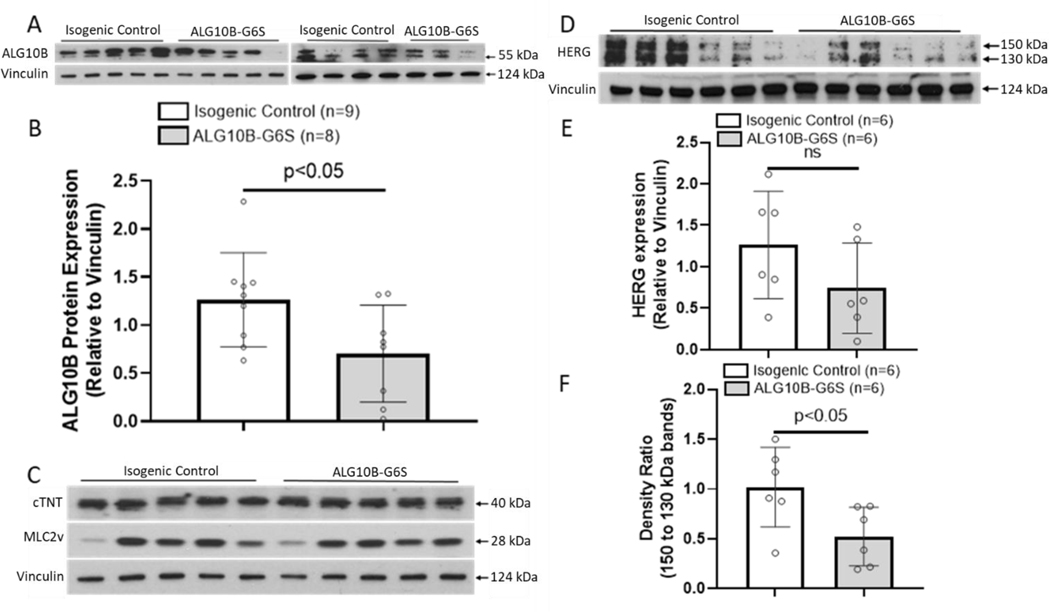
Figure 6 |. ALG10B expression was significantly decreased in ALG10B-G6S iPSC-CMs.
A. Western blot demonstrating ALG10B expression (relative to Vinculin) in isogenic control and ALG10B-G6S iPSC-CMs. B. Bar graph showing ALG10B expression in isogenic control (n=9) and ALG10B-G6S iPSC-CMs (n=8) by western blot data analysis. C. Western blot demonstrating cTNT, MLC2v expression (relative to Vinculin) in isogenic control and ALG10B-G6S iPSC-CMs. D. Western blot demonstrating HERG expression (relative to Vinculin) in isogenic control and ALG10B-G6S iPSC-CMs. E. Bar graph showing HERG expression in isogenic control (n=6) and ALG10B-G6S iPSC-CMs (n=6). F. Bar graph showing density ratio of 2 bands of HERG isogenic control (n=6) and ALG10B-G6S iPSC-CMs (n=6). All values represent mean ± SEM.

