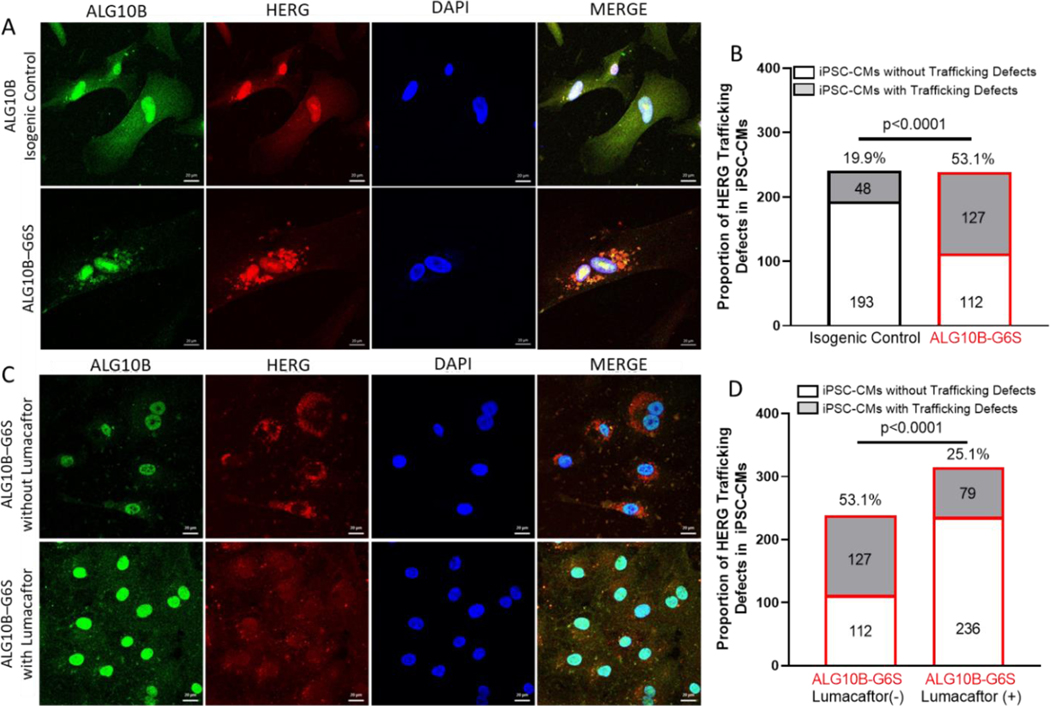
Figure 7 |. Defective trafficking of hERG was restored by Lumacaftor in ALG10B-G6S iPSC-CMs.
A. Representative immunofluorescence images from isogenic control (on top) and ALG10B-G6S (on bottom) showing for ALG10B (green), HERG (red), nucleus (blue). B. Bar graph showing proportion of iPSC-CMs with HERG retaining in endoplasmic reticulum (ER) from isogenic control (48 out of 241 cells, 19.9%) and ALG10B-G6S (127 out of 239, 53.1%). C. Representative immunofluorescence images from ALG10B-G6S without Lumacaftor (on top) and ALG10B-G6S with Lumacaftor (on bottom) showing for ALG10B (green), HERG (red), nucleus (blue). B. Bar graph showing proportion of iPSC-CMs with HERG retaining in ER from ALG10B-G6S without Lumacaftor (127 out of 239, 53.1%) and ALG10B-G6S with Lumacaftor (79 out of 315, 25.1%).

