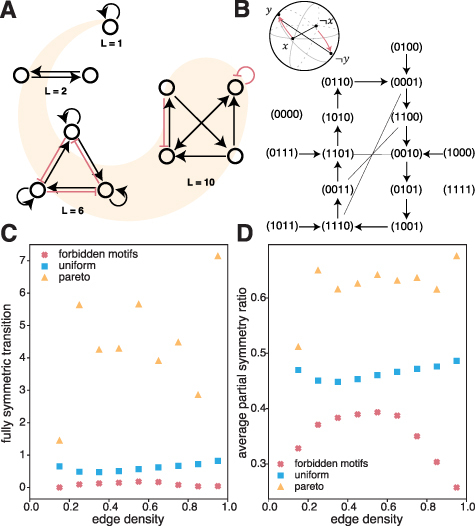
Figure 4.

The role of symmetries in cycle dynamics.(A) Example networks of up to 4 nodes, with the highest cycle length possible in that network size. (B) The state space of the n = 4 network shown in panel (A). The lines without arrowheads represent the states linked under the reflection symmetry (e.g. ‘(0,0,0,1)’ is linked to ‘(1,1,1,0)’). The top right schematic shows conceptually how the reflection symmetry affects the system’s dynamics where a state x is mapped under time evolution to the state y. (C) Average number of fully symmetric transitions. (D) We sample the average partial symmetry ratio, the fraction of bits that transition symmetrically, for random networks (blue), evolved networks (orange), and suppressed motif networks (red).
