
Figure A3.
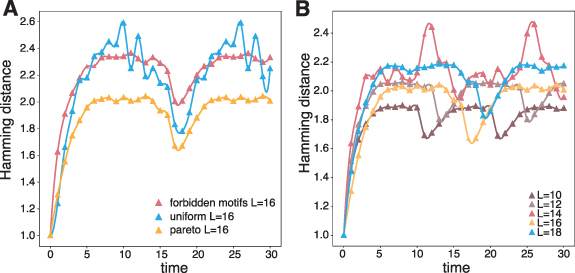
Time evolution of perturbations. (A) Average Hamming distance from the 1 bit perturbed network to the unperturbed network as a function of the time for the Pareto front networks binned by cycle length. (B) Same as in panel (A) but for a maximal cycle length of 16 and plotted separately for Pareto front networks, random networks, and suppressed motif networks.