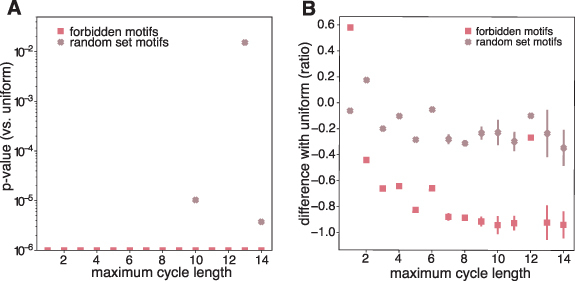
Figure A4.

Statistical analysis. (A) The p-values for the comparison with the uniformly sampled networks shown in figure 3.D. The p-values were capped at 10−6 when their values were smaller than this number. (B) Proportion difference between the uniformly sampled networks and the motifs enriched networks with the confidence interval shown as error bars.
