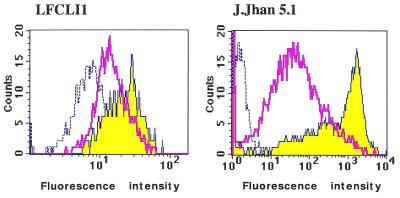
Figure 4.
Cell uptake studied by flow cytometry. Two different cell lines, LFCLI1 (left) and J.Jhan5.1 (right), were transfected during 24 h with 5′-fluorescein C-5 propyne phosphorothioate oligonucleotide encapsulated in either formulations F1 and F2. Dashed lines represent the untreated cells, the broad line corresponds to the F1 formulation and the filled spectrum to the F2 formulation.

