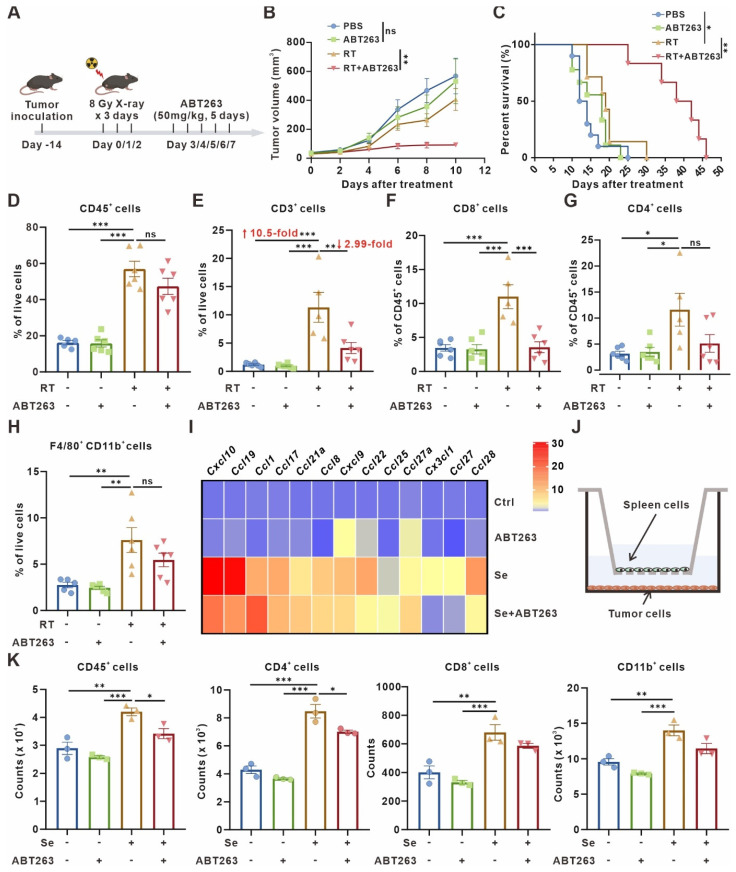
Figure 4.
Clearance of senescent cells inhibits tumor growth but disrupts T-cell infiltration. (A) Schematic of experiment to assess efficacy of ABT263-senescence removal treatment in mouse model. (B) Tumor growth curves of LLC subcutaneous transplant model in corresponding treatment groups (n = 6 to 7 per group), analyzed by 2-way ANOVA. (C) Kaplan-Meier survival plot of LLC lung cancer-bearing mice in the corresponding treatment groups described in (B) (n = 6 to 10 per group). (D-H) Flow cytometry analysis of changes in the immune cells in the TME of LLC subcutaneous transplant model that underwent different treatments (n = 5 to 6 per group). (I) Heatmap of T cell-related chemokines results from senescent LLCs and/or treated with ABT263(100 nM) for 48 h. Data presented as mean of 3 biological replicates. (J) Pattern diagram of transwell migration assay. (K) ABT263 inhibited the chemotactic effects of senescent LLCs on CD45+ cells, CD4+ T cells, CD8+ T cells, and CD11b+ myeloid cells. The indicated results represent the mean ± SEM of 3 independent experiments, analyzed by one-way ANOVA. *p < 0.05; **p < 0.01; ***p < 0.001; ns, not statistically significant.

