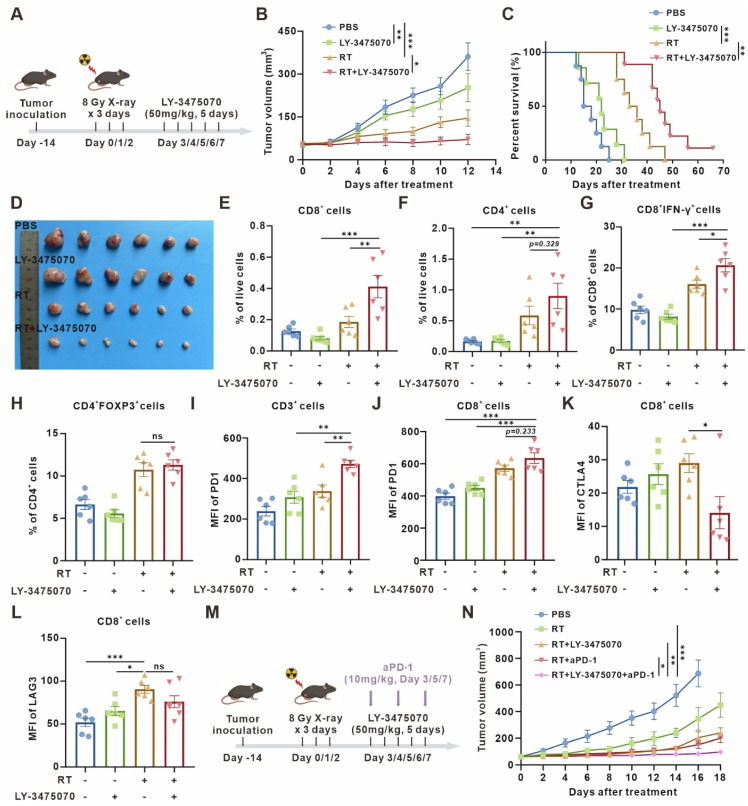
Figure 5.
Targeted inhibition of CD73 in the senescent TME inhibits tumor growth and triggers anti-tumor immunity. (A) Schematic of experiment to assess efficacy of LY-3475070 in the senescent TME in mouse model. (B) Tumor growth curves of LLC subcutaneous transplant model in corresponding treatment groups (n = 6 to 7 per group), analyzed by 2-way ANOVA. (C) Kaplan-Meier survival plot of LLC lung cancer-bearing mice in the corresponding treatment groups described in (B) (n = 7 to 9 per group). (D) Photo of dissected tumors in each group. (E-H) Flow cytometry analysis of changes in the immune cells in the TME of LLC subcutaneous transplant model that underwent different treatments (n = 6 per group). (I-J) Flow cytometry analysis of PD-1 expression on the surface of CD3+ T cells, and CD8+ T cells of LLC subcutaneous transplant model that underwent different treatments (n = 6 per group). (K-L) Flow cytometry analysis of CTLA4 (K) and LAG3 (L) expression on the surface of CD8+ T cells of LLC subcutaneous transplant model that underwent different treatments (n = 6 per group). (M) Schematic of experiment to assess efficacy of LY-3475070 combined with anti-PD-1 mAb in the senescent TME in mouse model. (N) Tumor growth curves of LLC subcutaneous transplant model in corresponding treatment groups (n = 6 to 7 per group), analyzed by 2-way ANOVA. *p < 0.05; **p < 0.01; ***p < 0.001; ns, not statistically significant.

