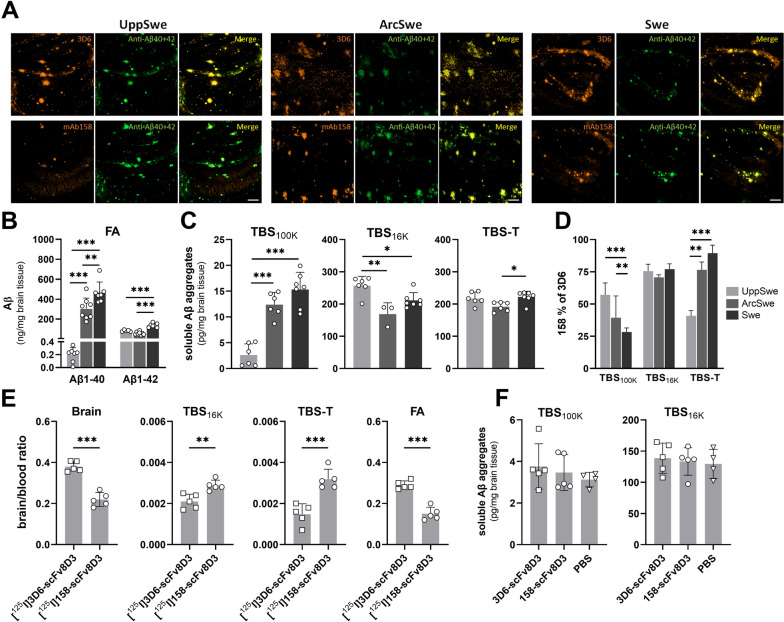
Fig. 4.
Aβ immunostaining and ELISA-based measurements of Aβ aggregates in brain tissue from tg-UppSwe, tg-ArcSwe and tg-Swe mice. A Immunostaining of tg-UppSwe, tgArcSwe and tg-Swe brain tissue sections (hippocampus, 40× magnification) with 3D6 (yellow, upper panel) or mAb158 (yellow, lower panel) in comparison with double staining using Aβ40 and Aβ42-specific antibodies (green). Scale bar: 200 µm. B ELISA quantification of total Aβ1-40 and 1-42 levels in FA brain extract. C 3D6-3D6 ELISA quantification of total Aβ aggregates in TBS100K, TBS16K and TBS-T brain extracts. D mAb158 positive fraction of the total Aβ aggregates detected by 3D6-3D6 ELISA in TBS100K, TBS16K and TBS-T brain extracts. E Distribution of [125I]RmAb3D6-scFv8D3 and [125I]RmAb158-scFv8D3, three days after administration of these bispecific antibodies at 32 nmol/kg body weight (therapeutic dose) to 18-month-old tg-UppSwe mice, expressed as a brain-to-blood radioactivity ratio in whole brain tissue (Brain) and in TBS16K, TBS-T and FA extracts. F Soluble Aβ aggregates in TBS100K and TBS16 K brain extracts from 18 months old tg-UppSwe mice three days after administration of a therapeutic dose (32 nmol/kg) of [125I]RmAb3D6-scFv8D3 or [125I]RmAb158-scFv8D3, in comparison with PBS. Non-significant (ns), *P < 0.05, **P < 0.01, ***P < 0.001

