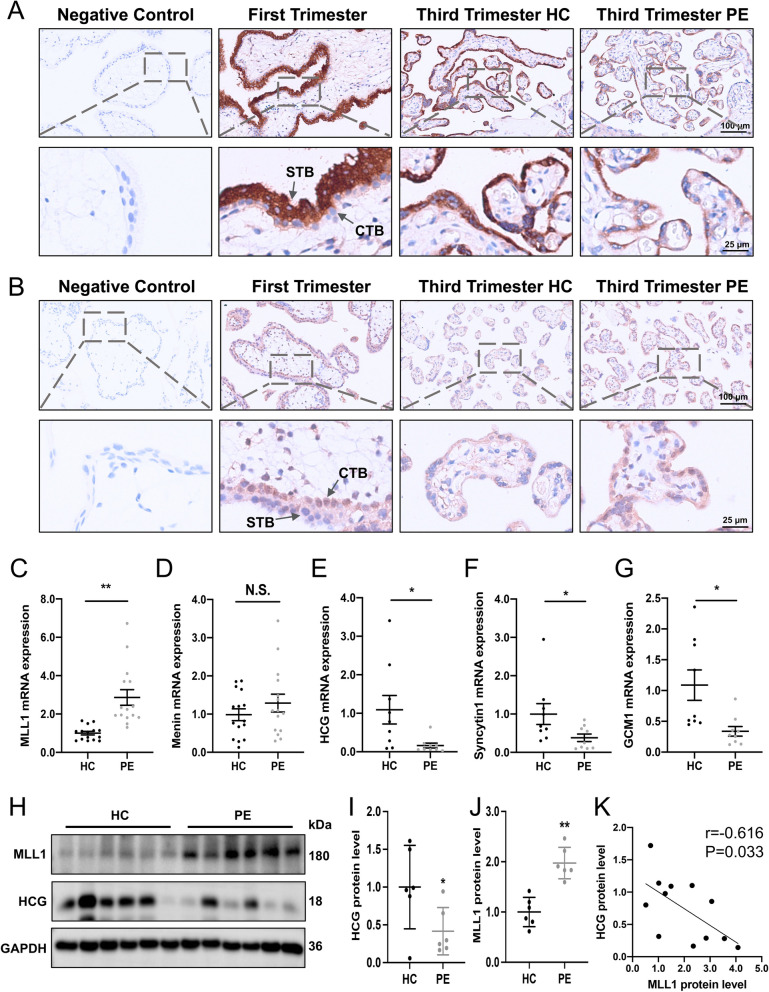
Fig. 3.
Distribution and levels of MLL1 and STB markers in human placental villi. A-B Immunohistochemical analysis of MLL1 (A) and HCG (B) staining in pregnant women during the first trimester (n = 6), third trimester (n = 6), and preeclampsia (n = 6). C-G mRNA levels of MLL1 (n = 15), MEN1 (n = 15), and STB (n = 9) markers in women with preeclampsia and healthy controls. H-J Western blots (H) and corresponding quantification (I and J) of MLL1 and HCG in the PE (n = 6) and control women (n = 6). K The MLL1 protein level correlated negatively with the protein level of HCG in placental villi. Data are presented as the means ± SD. **P < 0.01, *P < 0.05. HC, healthy control; PE, preeclampsia; CTB, cytotrophoblast; MEN1, menin

