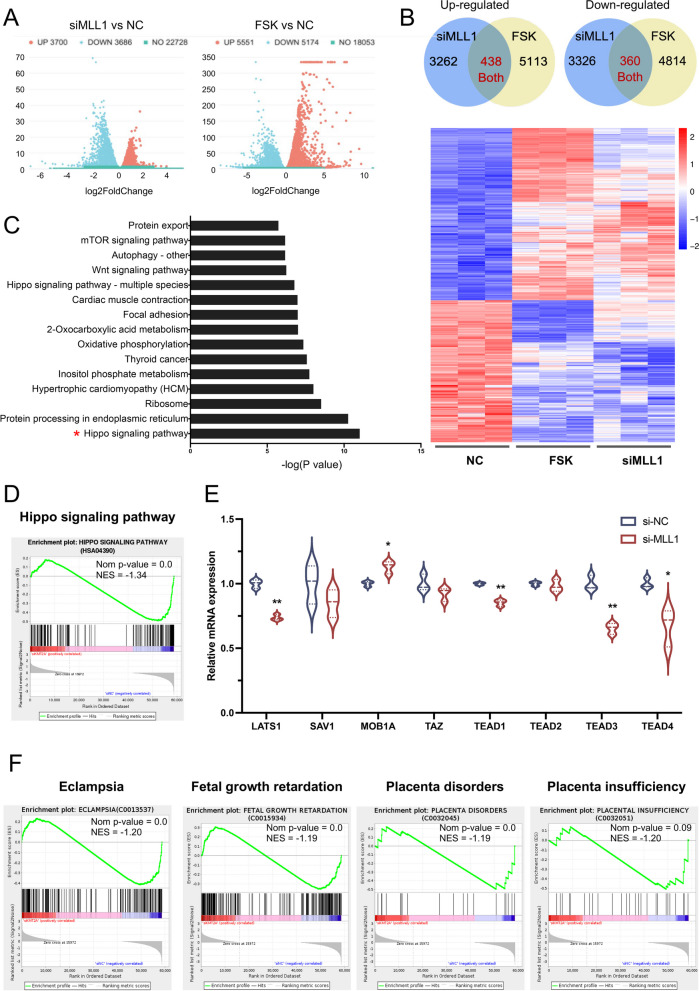
Fig. 4.
MLL1 knockdown in BeWo cells leads to downregulation of the Hippo signaling pathway. A Volcano plot showing differentially expressed genes after MLL1 knockdown or FSK treatment. B Differentially expressed gene sets with either upregulation or downregulation in both the siMLL and FSK groups. C KEGG analyses conducted on 798 genes that were identified as differentially expressed after MLL1 knockdown and are associated with the syncytialization process. D GSEA plot showing the enrichment of Hippo signaling pathway genes in the siMLL group compared with that in the NC group. E The relative expression of core regulators in the Hippo signaling pathway. F GSEA plot showing the enrichment of diseases related to placental development in the siMLL group compared with those in the NC group. Data are presented as the means ± SD. **P < 0.01. KEGG, Kyoto Encyclopedia of Genes and Genomes; GSEA, gene set enrichment analysis; NC, negative control; NES, normalized enrichment score; LATS1, large tumor suppressor kinase 1; SAV1, salvador family WW domain containing protein 1; MOB1A, MOB kinase activator 1A; TEAD, TEA domain transcription factor

