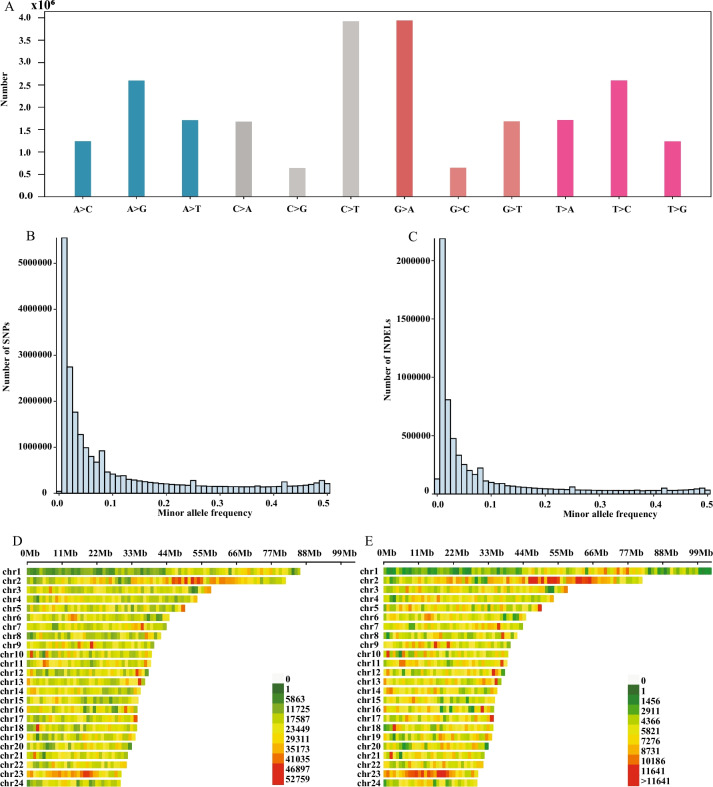
Fig. 1.
SNP and InDel information. A. SNP marker type distribution; B. Minor allele frequency (MAF) distribution of SNPs; C. MAF distribution of InDels; D. Density distribution of SNPs within 1 Mb on the chromosome; E. Density distribution of InDels within 1 Mb on the chromosome. A, G, C and T represent adenine deoxynucleotides, guanine deoxynucleotides, cytosine deoxynucleotides and thymine deoxynucleotides, respectively. Chr1-24 represents chromosomes 1–24; SNPs represent single nucleotide polymorphisms; InDels represent insertions and deletions; and Mb represents megabase

