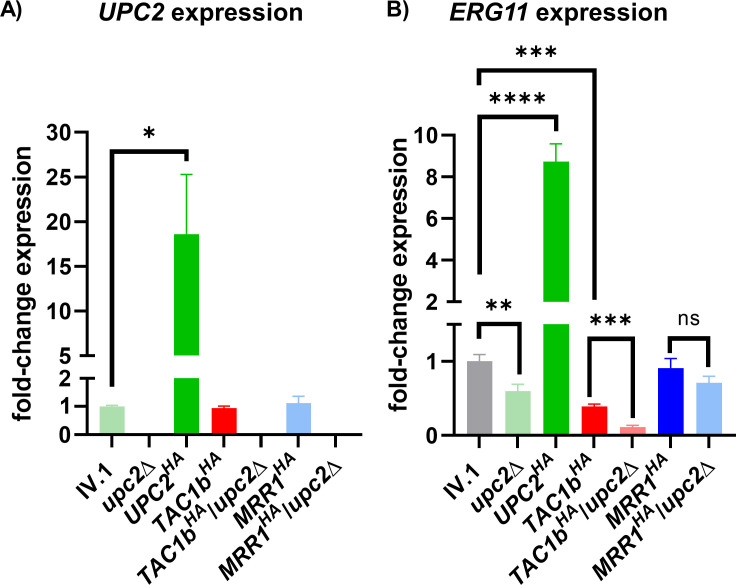
Fig 1.
Relative expression of UPC2 (A) and ERG11 (B) in the different strains of this study. Results are expressed as fold-change compared to the wild-type IV.1 strain. Bars represent means with standard deviations of three biological replicates. The brackets show the conditions that were compared using the t-test method and interpreted as statistically significant: * P-value ≤ 0.05, ** P-value ≤ 0.01, *** P-value ≤ 0.001, and **** P-value ≤ 0.0001; not statistically significant: ns.

