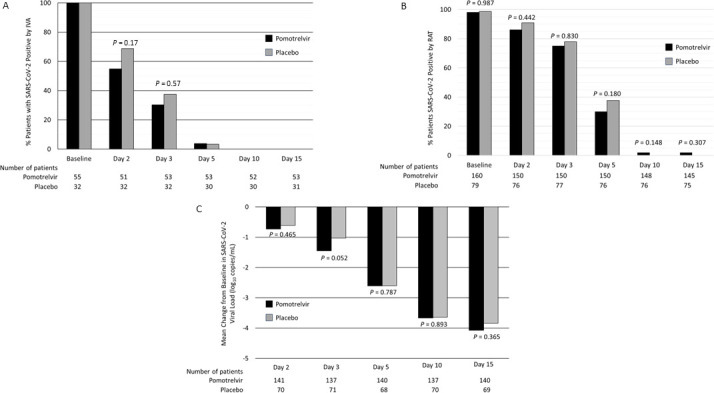
Fig 1.

Proportion of patients positive for SARS-CoV-2 by time point assessed by IVA (A) and RAT (B) and change from baseline in SARS-CoV-2 viral load (qRT-PCR) by time point (C). (A) Proportion of patients with positive SARS-CoV-2 by IVA (mITTV analysis set), (B) proportion of patients with positive SARS-CoV-2 by RAT (mITT analysis set), and (C) mean change from baseline in SARS-CoV-2 viral load (quantitative reverse transcriptase-PCR, ITT analysis set).
