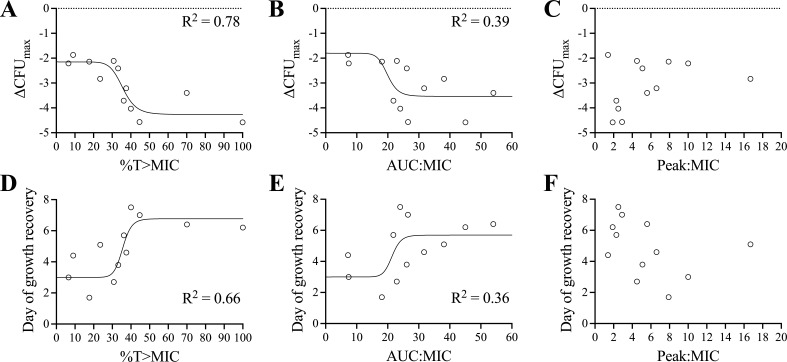
Fig 3.
Sigmoidal inhibitory Emax regression models of PK-PD indices describing the microbiological response of Mab to amikacin in the HFIM. ΔCFUmax (A–C) and day of growth recovery (D–F) are shown relative to %T > MIC (A and D), AUC24:MIC (B and E), and Peak:MIC (C and F). R2 associated with each curve is shown. Peak:MIC did not fit any sigmoidal regression model.

