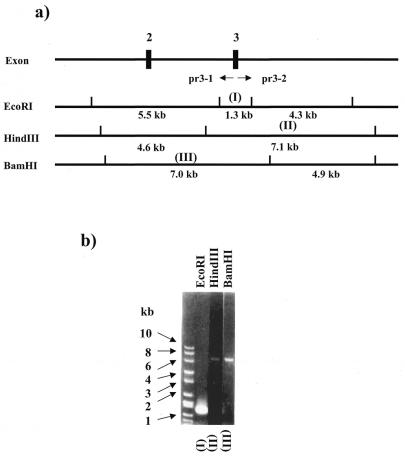
Figure 2.
IPCR results. (a) Restriction map of the mouse HPRT gene. Two PCR primers are shown with pr3-1 and pr3-2. (b) Three IPCR products amplified with pr3-1 and pr3-2 are shown. Lanes (I) to (III) represent each of the amplified products derived from each restricted fragment indicated in (I) to (III) of (a).

