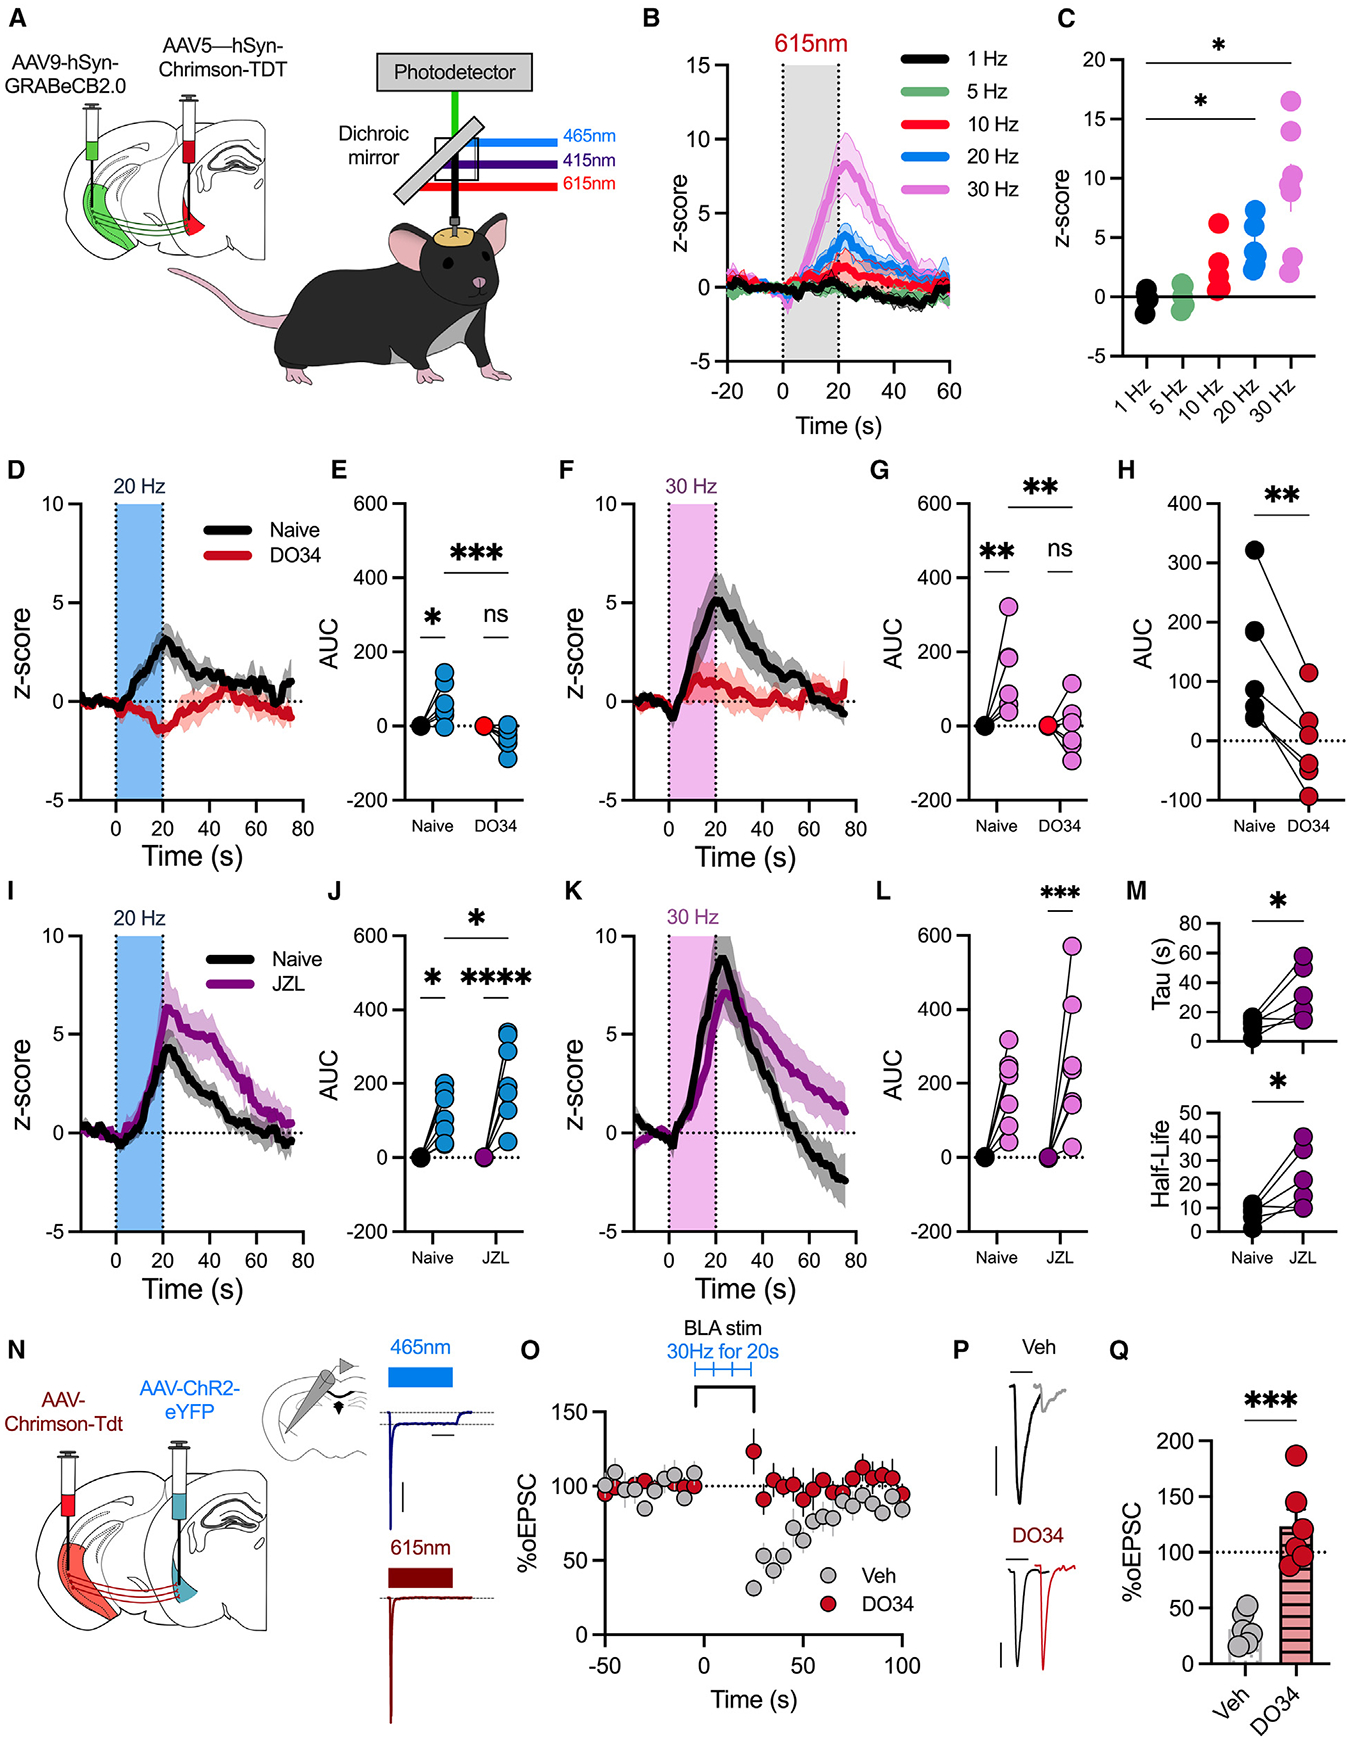
Figure 1. BLA activity promotes increase in GRAB-eCB2.0 biosensor and endogenous CB1R activation at vHPC-BLA synapses.

(A) A virus expressing GRAB-eCB-2.0 was delivered to the vHPC, and Chrimson was delivered to the ipsilateral BLA. A fiber optic was implanted above the BLA. In vivo fiber photometry recordings were conducted to simultaneously record changes in GFP fluorescence and stimulate BLA neurons (n = 7 male mice).
(B) Z score of ΔF/F following 20 s of Chrimson stimulation at different frequencies.
(C) Average change in Z score 5 s after stimulation (0–20 s) stops.
(D) Z score of ΔF/F following BLA stimulation (20 Hz, 20 s) in naive mice or mice pretreated with the DAGL inhibitor DO34.
(E) Quantification of area under the curve (AUC) from (D).
(F) Z score of ΔF/F following BLA stimulation (30 Hz, 20 s) in naive mice or DO34-pretreated mice.
(G) Quantification of AUC from (F).
(H) Within-subject comparison of data in (G).
(I) Z score of ΔF/F following BLA stimulation (20 Hz, 20 s) in naive mice or mice pretreated with the MAGL inhibitor JZL184.
(J) Quantification of AUC from (I).
(K) Z score of ΔF/F following BLA stimulation (30 Hz, 20 s) in naive mice or mice pretreated with the MAGL inhibitor JZL184.
(L) Quantification of AUC from (K).
(M) Decay constant, tau, following JZL184 pretreatment (top); half-life of Z score (bottom).
(N) Schematic of electrophysiological experiments. AAV-ChR2 was delivered to the BLA, and AAV-Chrimson was delivered to the vHPC. Electrophysiological recordings were performed from BLA pyramidal neurons. Representative traces demonstrating that 465 nm light induces depolarization indicative of somatic ChR2, while 615 nm light induces exclusively vHPC-BLA optically evoked excitatory postsynaptic currents (oEPSCs) with no somatic current. Scale bar represents 200 ms and 200 pA. Each data point represents one cell from 5 mice.
(O) Time course of percentage of oEPSC amplitude following stimulation of BLA neurons (30 Hz, 20 s). Slices were incubated in vehicle or DO34 (2.5 μM).
(P) Representative traces of oEPSC amplitude in slices incubated in vehicle (top; scale bar represents 25 ms and 100 pA) or DO34 (bottom; scale bar represents 25 ms and 200 pA).
(Q) Average percentage of oEPSC depression following BLA stimulation.
Data were analyzed by one-way ANOVA (C), two-way ANOVA (E, G, J, and L), Student’s paired two-tailed t test (H and M), or unpaired t test (Q). *p < 0.05, **p < 0.01, ***p < 0.001, ****p < 0.0001. Error bars represent SEM.
