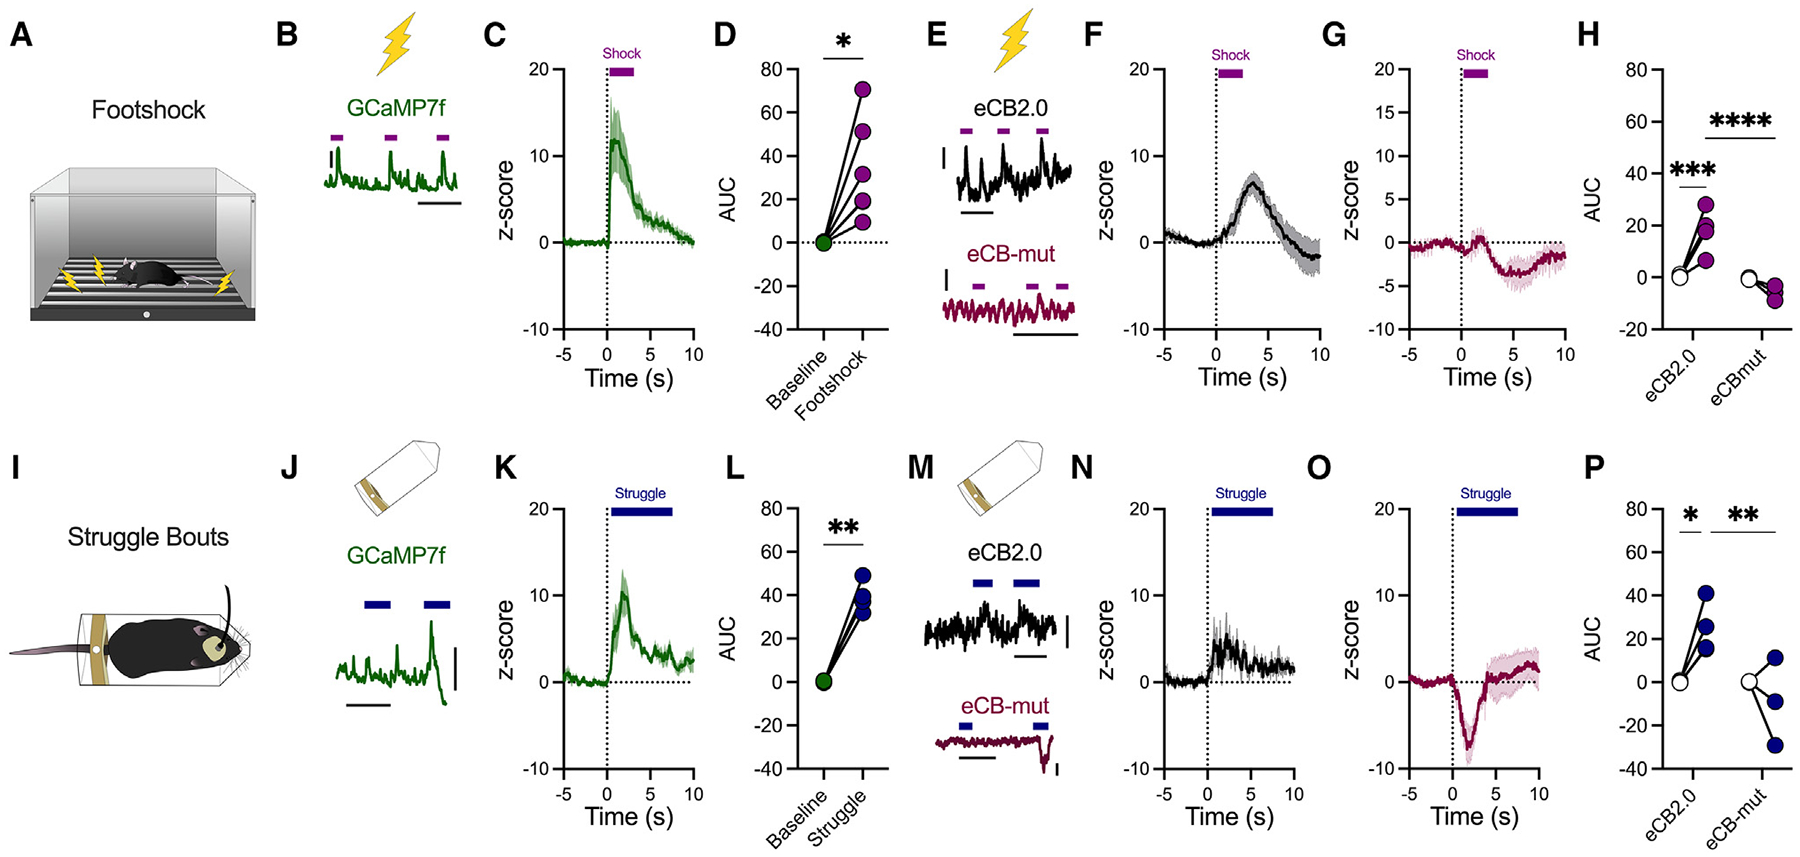
Figure 2. Footshock and active stress coping recruit BLA activity and eCB production.

(A) Footshock stress diagram.
(B) Representative ΔF/F trace of mice injected with a virus expressing GCaMP7f (AAVrg-hSyn-jGCaMP7f-WPRE) into the BLA and photometry recordings of somatic BLA activity were conducted during footshock exposure (purple bars) (n = 6 male mice; scale bar represents 0.1 ΔF/F and 50 ms).
(C) Z score of ΔF/F following footshock in GCaMP7f-injected mice; baseline was −3 s to −1 s before footshock onset (0 s).
(D) AUC of (C).
(E) Representative trace of ΔF/F during footshock (purple bars) in mice injected with a virus expressing the GRAB-eCB2.0 (top) or eCB-mut (bottom). Scale bar represents 0.005 ΔF/F and 50 ms.
(F) Z score of ΔF/F following footshock in GRAB-eCB2.0 mice (n = 5 male mice).
(G) Z score of ΔF/F following footshock in GRAB-eCB-mut mice (n = 3 male mice).
(H) Quantification of AUC following footshock in GRAB-eCB2.0 or GRAB-eCB-mut mice.
(I) Struggle behavior during restraint stress.
(J) Representative ΔF/F trace of mice injected with a virus expressing GCaMP7f into the BLA and recording of BLA activity during struggle (blue bars). Scale bar represents 0.05 ΔF/F and 20 ms.
(K) Z score of ΔF/F following struggle behavior in GCaMP7f mice (n = 4 male mice).
(L) AUC quantification from (K).
(M) Representative traces of ΔF/F during struggle behavior (blue bars) in GRAB-eCB2.0 (top) or GRAB-eCB-mut (bottom) mice. Scale bar represents 0.005 ΔF/F and 20 ms.
(N) Z score of ΔF/F following struggle behavior in GRAB-eCB2.0 mice (n = 5 male mice).
(O) Z score of ΔF/F following struggle behavior in GRAB-eCB-mut mice (n = 3 male mice).
(P) Quantification of AUC following struggle onset.
Data were analyzed via paired Student’s two-tailed t test (D and L) or two-way ANOVA (H and P). *p < 0.05, **p < 0.01, ***p <0.001, ****p < 0.0001. Error bars represent SEM.
