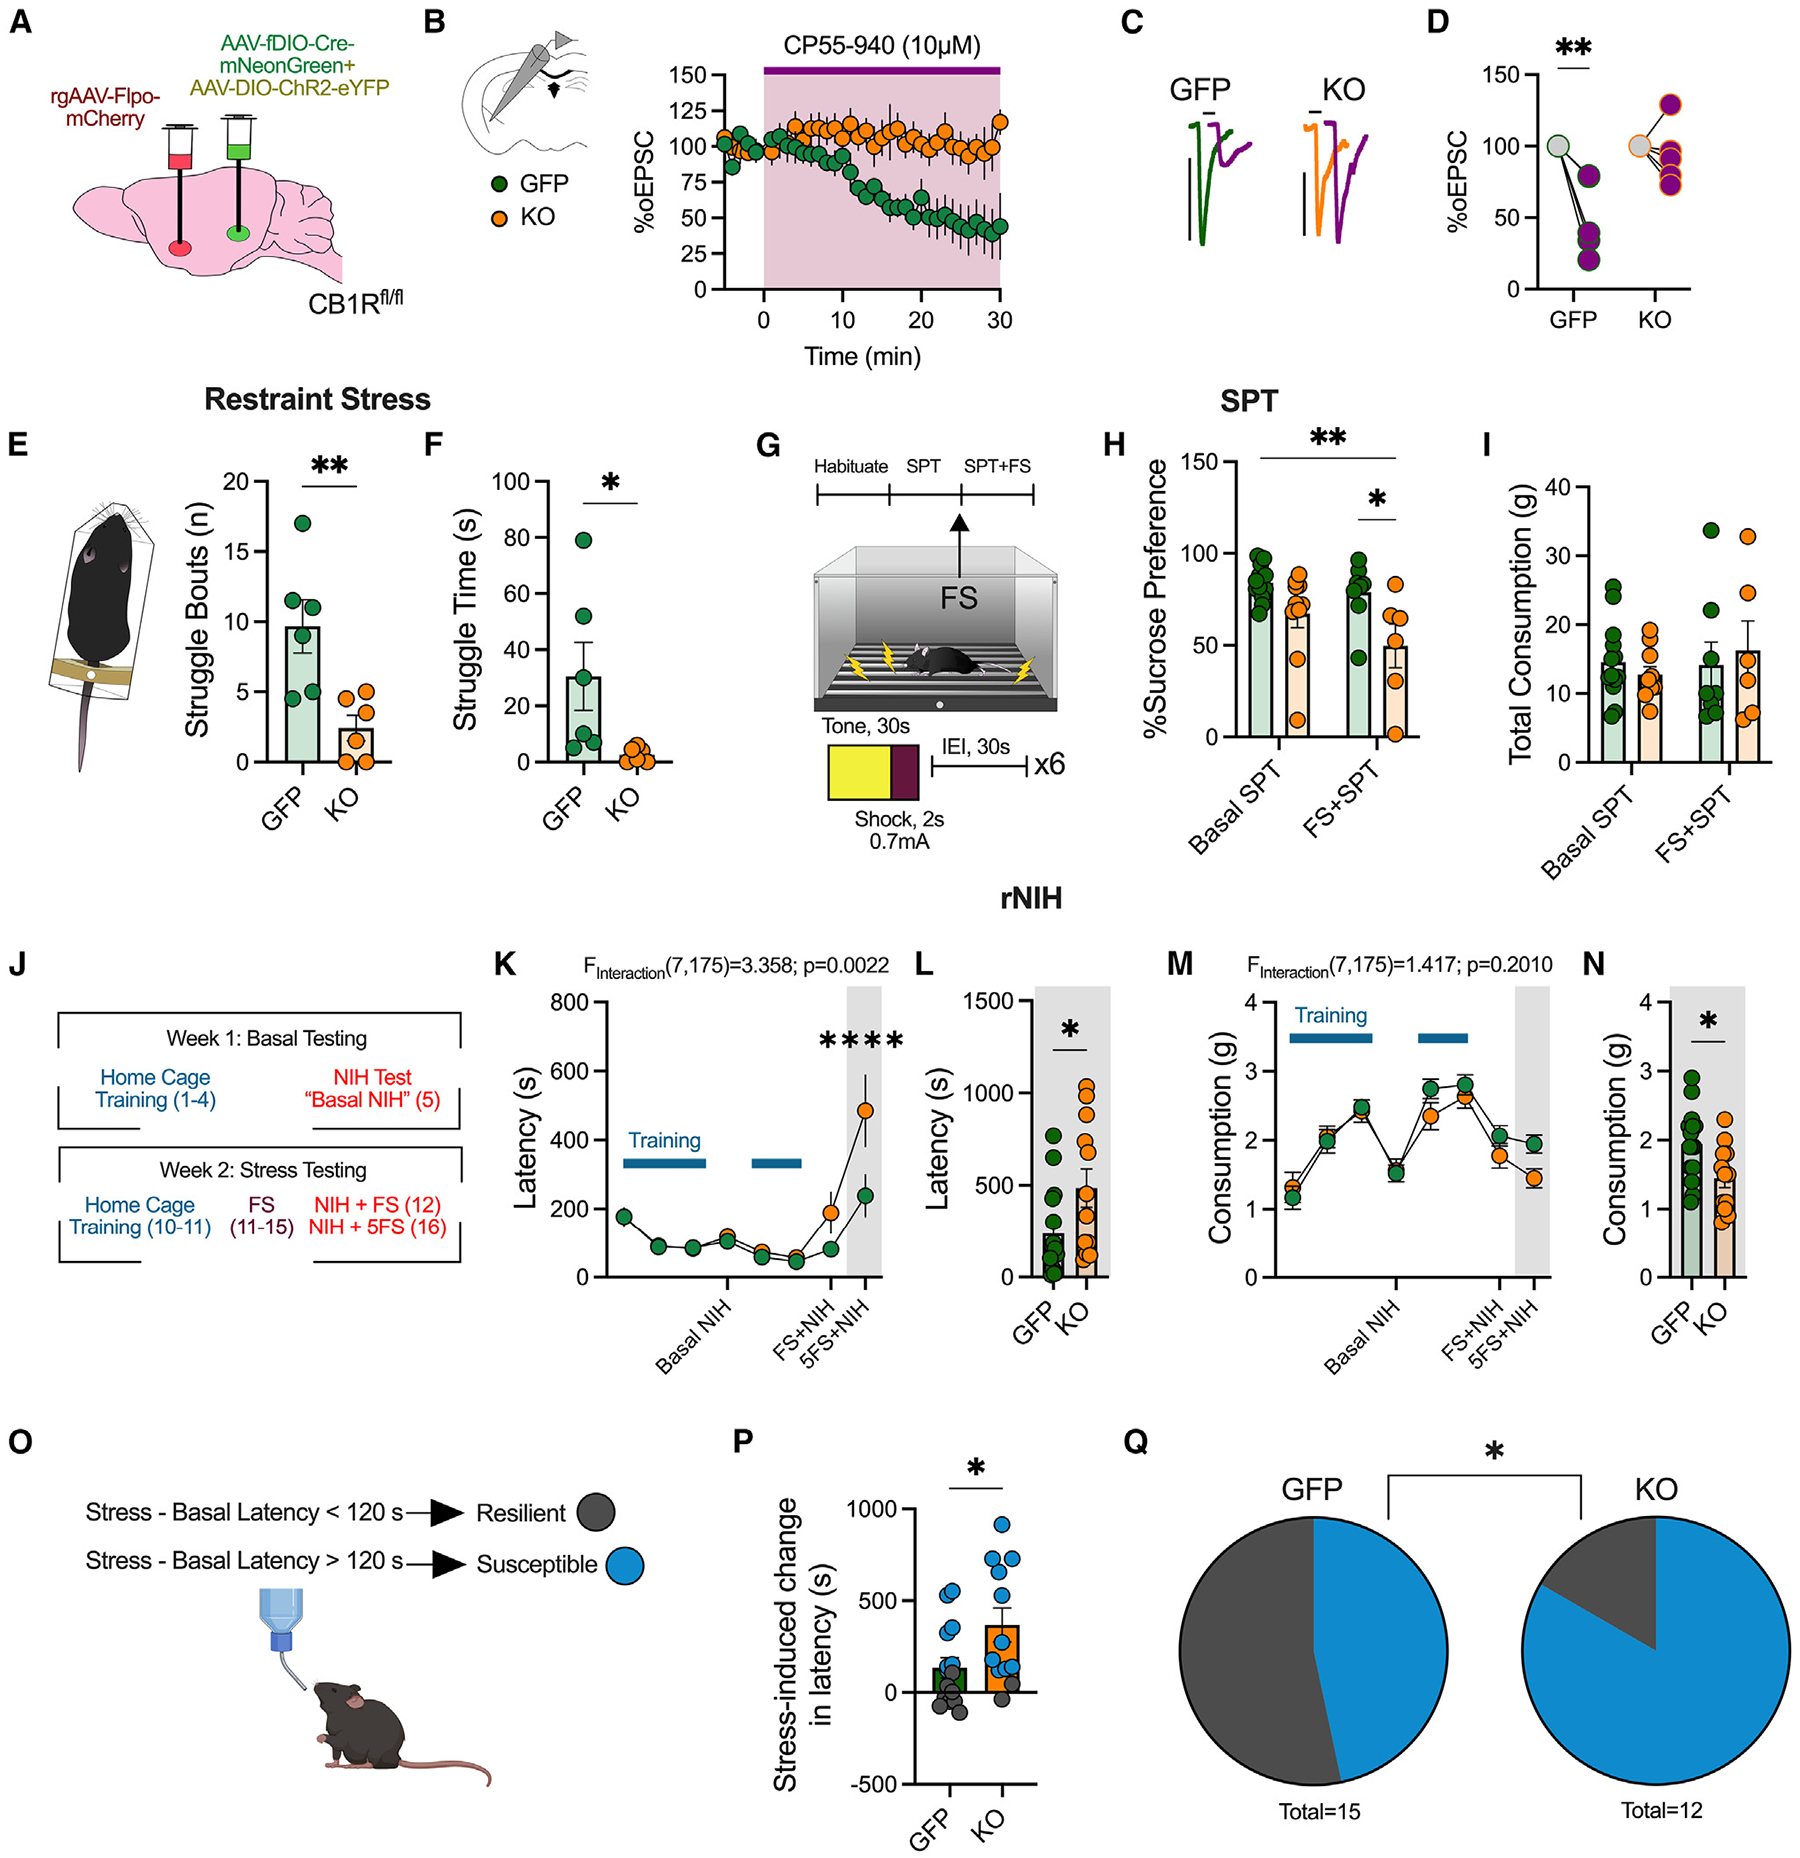
Figure 3. Deletion of vHPCCB1R-BLA decreases active stress coping, exacerbates stress-induced anhedonia and avoidance, and increases stress susceptibility.

(A) Schematic of experimental design and viral surgeries to selectively delete the CB1R from vHPC-BLA circuit (KO) or control (GFP).
(B) Ex vivo electrophysiological recordings from BLA pyramidal neurons. Time course of vHPC-mediated oEPSCs following bath application of CP55,940 (10 μM) (n = 3 male mice/group).
(C) Representative traces before and after CP55,940 wash-on in control mice (GFP) and vHPCCB1R KO-BLA mice (KO).
(D) Quantification of average percentage of oEPSC depression following CP55,940 wash-on.
(E) Average number of struggle bouts during 4 min restraint stress exposure (n = 6 male and female mice/group).
(F) Quantification of total time spent struggling during restraint.
(G) Experimental timeline for sucrose preference test (SPT). Basal SPT was assessed 24 h after sucrose was provided. Mice were then exposed to an acute footshock exposure, consisting of 6 shocks. 24 h after footshock, sucrose consumption was assessed again (FS + SPT).
(H) Percentage of sucrose preference basally and after one acute footshock session (GFP: n = 13, KO: n = 10 basal and GFP: n = 8 and KO: n = 6 post-stress, male and female mice).
(I) Total consumption of liquid (water and sucrose solution).
(J) Experimental timeline for repeated novelty induced hypophagia (rNIH) testing (GFP: n = 15 and KO: n = 12 male and female mice).
(K) Latency to drink Ensure over time.
(L) Feeding latency during NIH after 5 days of footshock stress.
(M) Consumption of Ensure over time.
(N) Consumption during NIH after 5 days of footshock stress.
(O) Criteria used for determining stress-susceptible versus-resilient mice.
(P) Quantification of stress-induced change in latency, comparing latency after 5 days of footshock with basal latency.
(Q) Proportion of susceptible versus resilient mice following vHPCCB1R KO-BLA.
Data were analyzed via two-way ANOVA (D, H, I, K, and M), unpaired Student’s t test (E, F, L, N, and P), or chi-squared test (Q) performed as analysis. *p < 0.05, **p < 0.01, ****p < 0.0001. Error bars represent SEM.
