. 2024 Feb 6;132(2):026001. doi: 10.1289/EHP13423

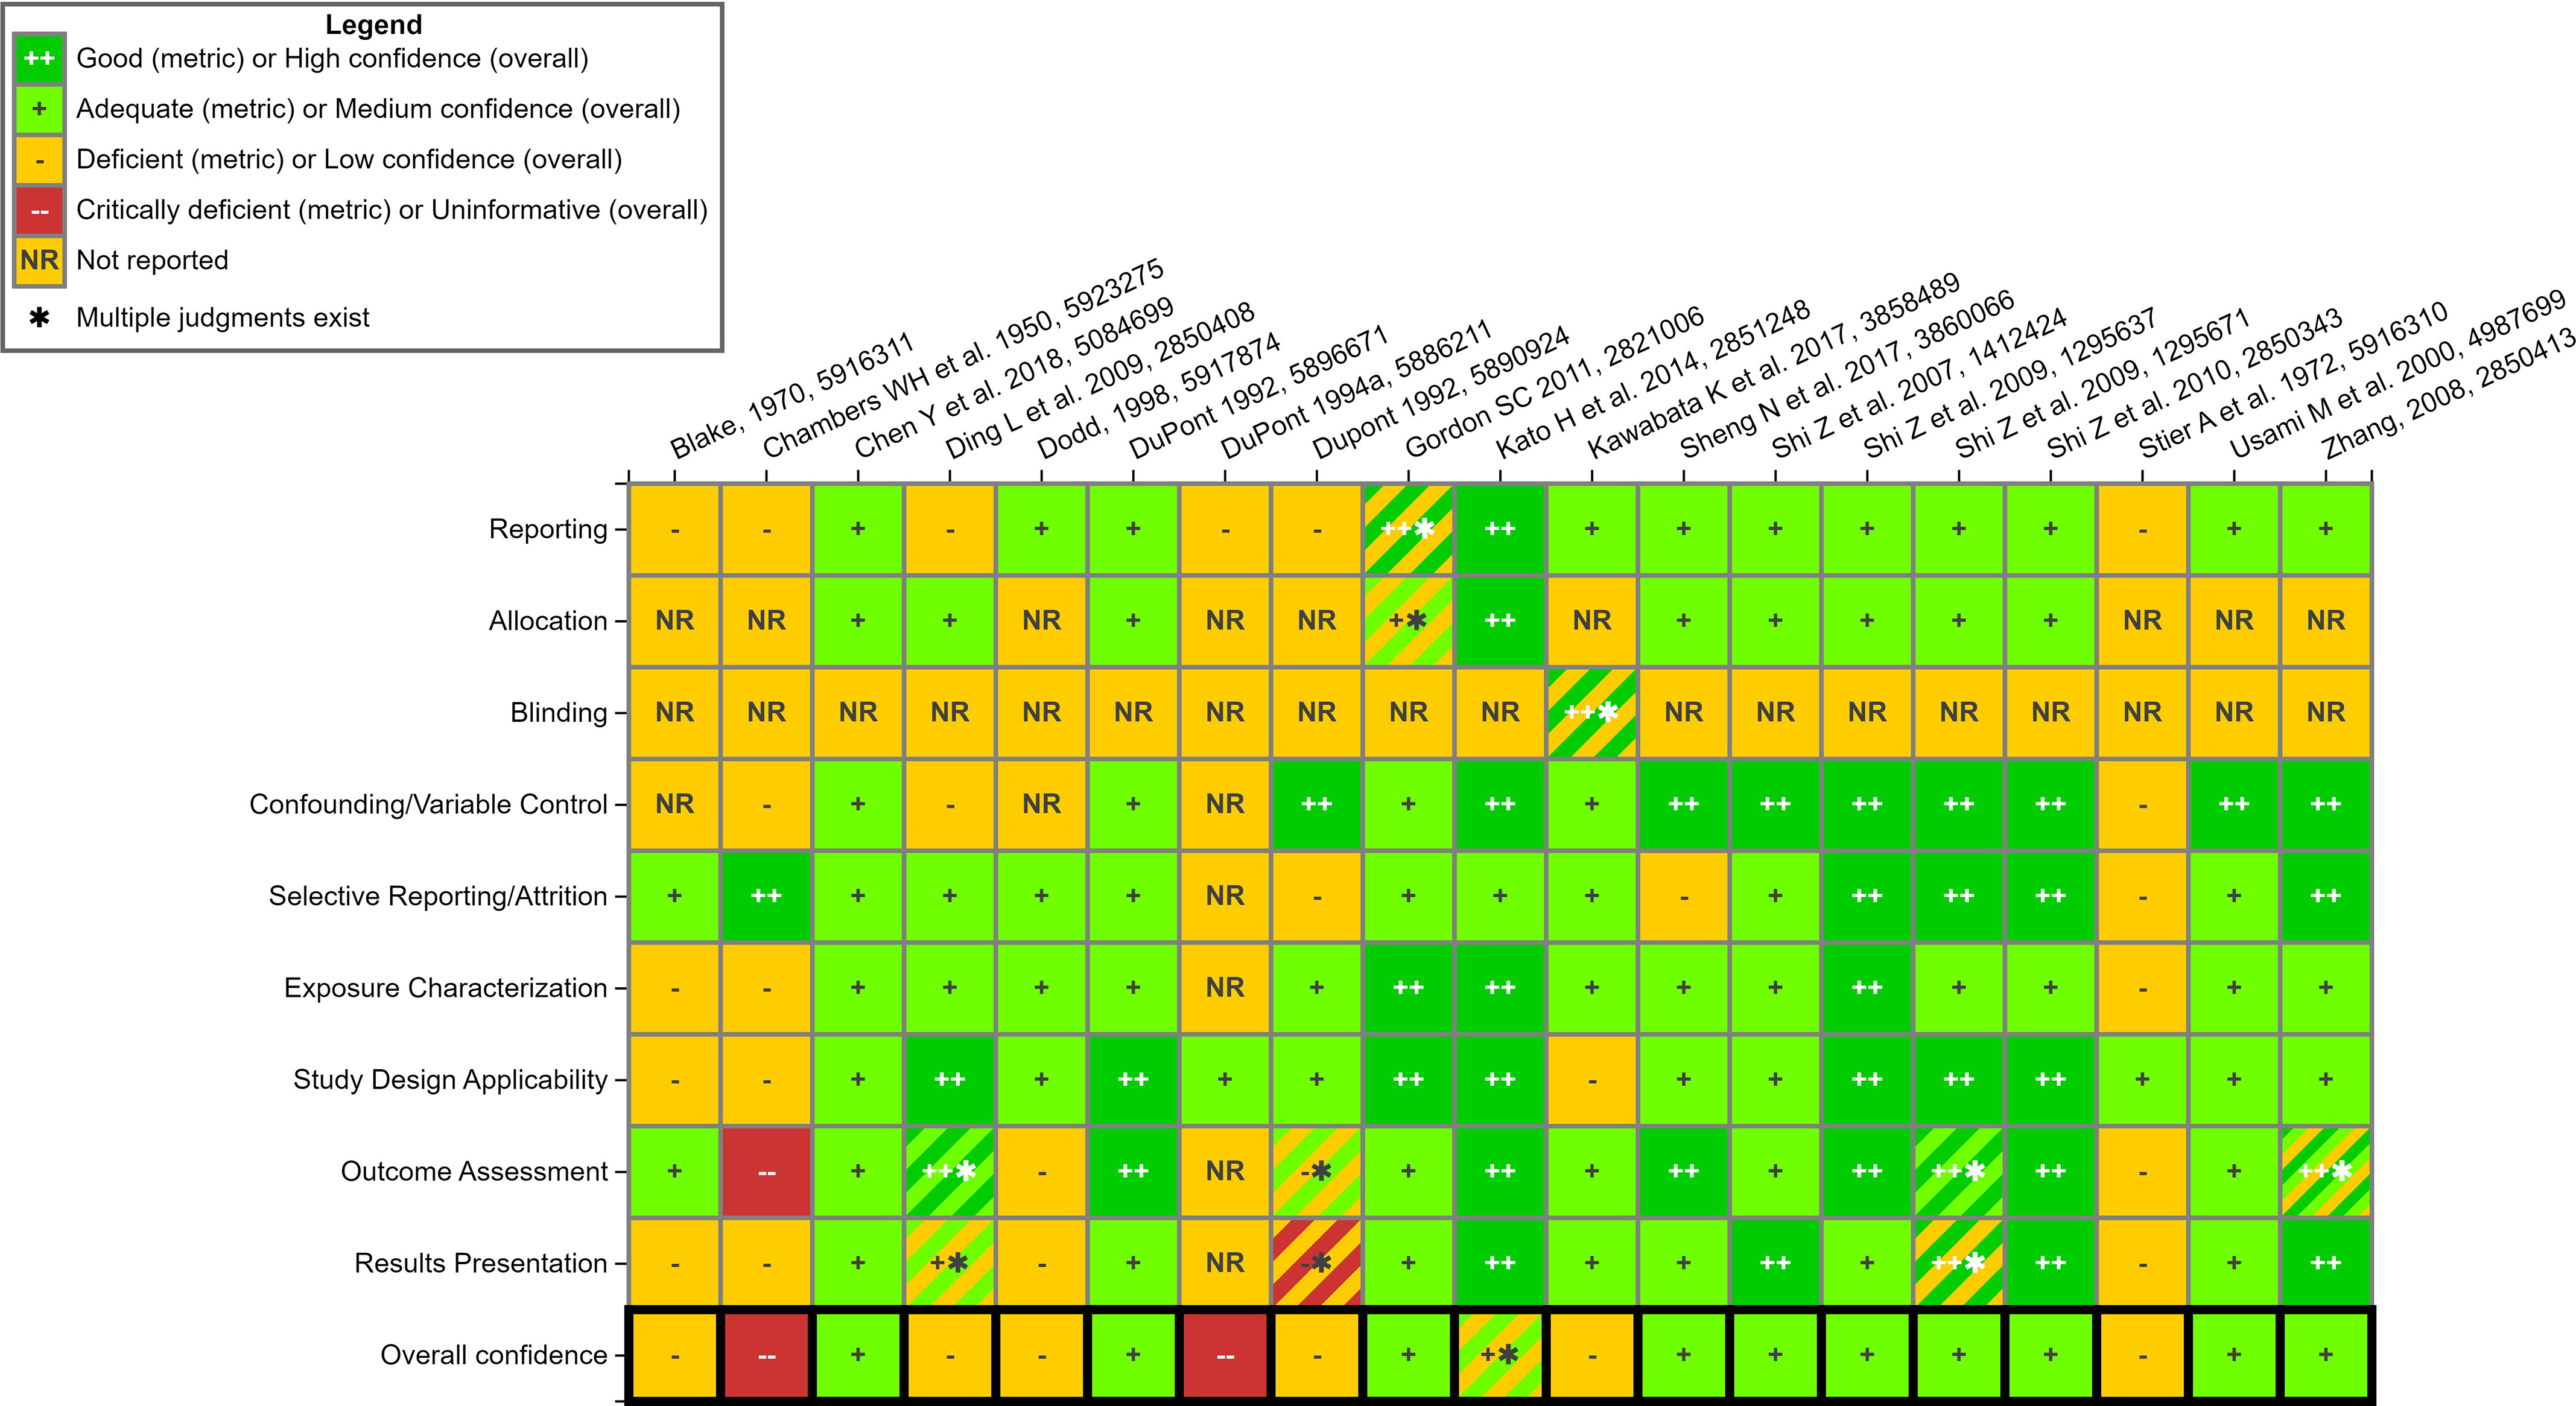
Figure 8.

Figure 8 is a heatmap, plotting overall confidence, results presentation, outcome assessment, study design applicability, exposure characterization, selective reporting or attrition, confounding or variable control, blinding, allocation, and reporting (y-axis) across Black, 1970 5916311; Chambers WH and others 1950, 5923275; Chen Y and others, 2018, 5084699; Ding L and others 2009, 2850408; Dodd, 1998, 5917874; DuPont, 1992, 5917871; DuPont, 1994a, 5886211; DuPont 1992, 5890924; Gordon S C 2011, 2821006; Kato H and others 2014, 2851248; Kawabata K and others 2017, 3858489; Sheng N and others 2017, Shi Z and others 2007, 1412424; Shi Z and others 2009, 1295637; Shi Z and others 2009, 1295671; Shi Z and others 2010, 2850343; Stier A and others 1972, 5916310; Usami M and others 2000, 4987699; and Zhang, 2008, 2850413 (x-axis) for Legend, including Good (metric) or High confidence (overall); Adequate (metric) or Medium confidence (overall); Deficient (metric) or Low confidence (overall); Critically deficient (metric) or uninformative (overall); not reported; and multiple judgments exist.

Study evaluation for mammalian bioassay studies- non-ECHA reports. This is a thumbnail image of the interactive visual (https://hawc.epa.gov/summary/visual/assessment/100500256/Animal-SQE-Heatmap_nonECHA/) accessed on 3 November 2023.67 The study evaluation approach follows standard methods that are used in systematic evidence maps developed by the US EPA27,28,32 and have only been adjusted, where appropriate, for the specific needs of this SEM. A full download of detailed evaluation summaries is available through HAWC, or in Excel Table S11. Note: ECHA, European Chemicals Agency; HAWC, Health Assessment Workspace Collaborative; SEM, Systematic Evidence Map.