. 2024 Feb 6;132(2):026001. doi: 10.1289/EHP13423

Figure 9.

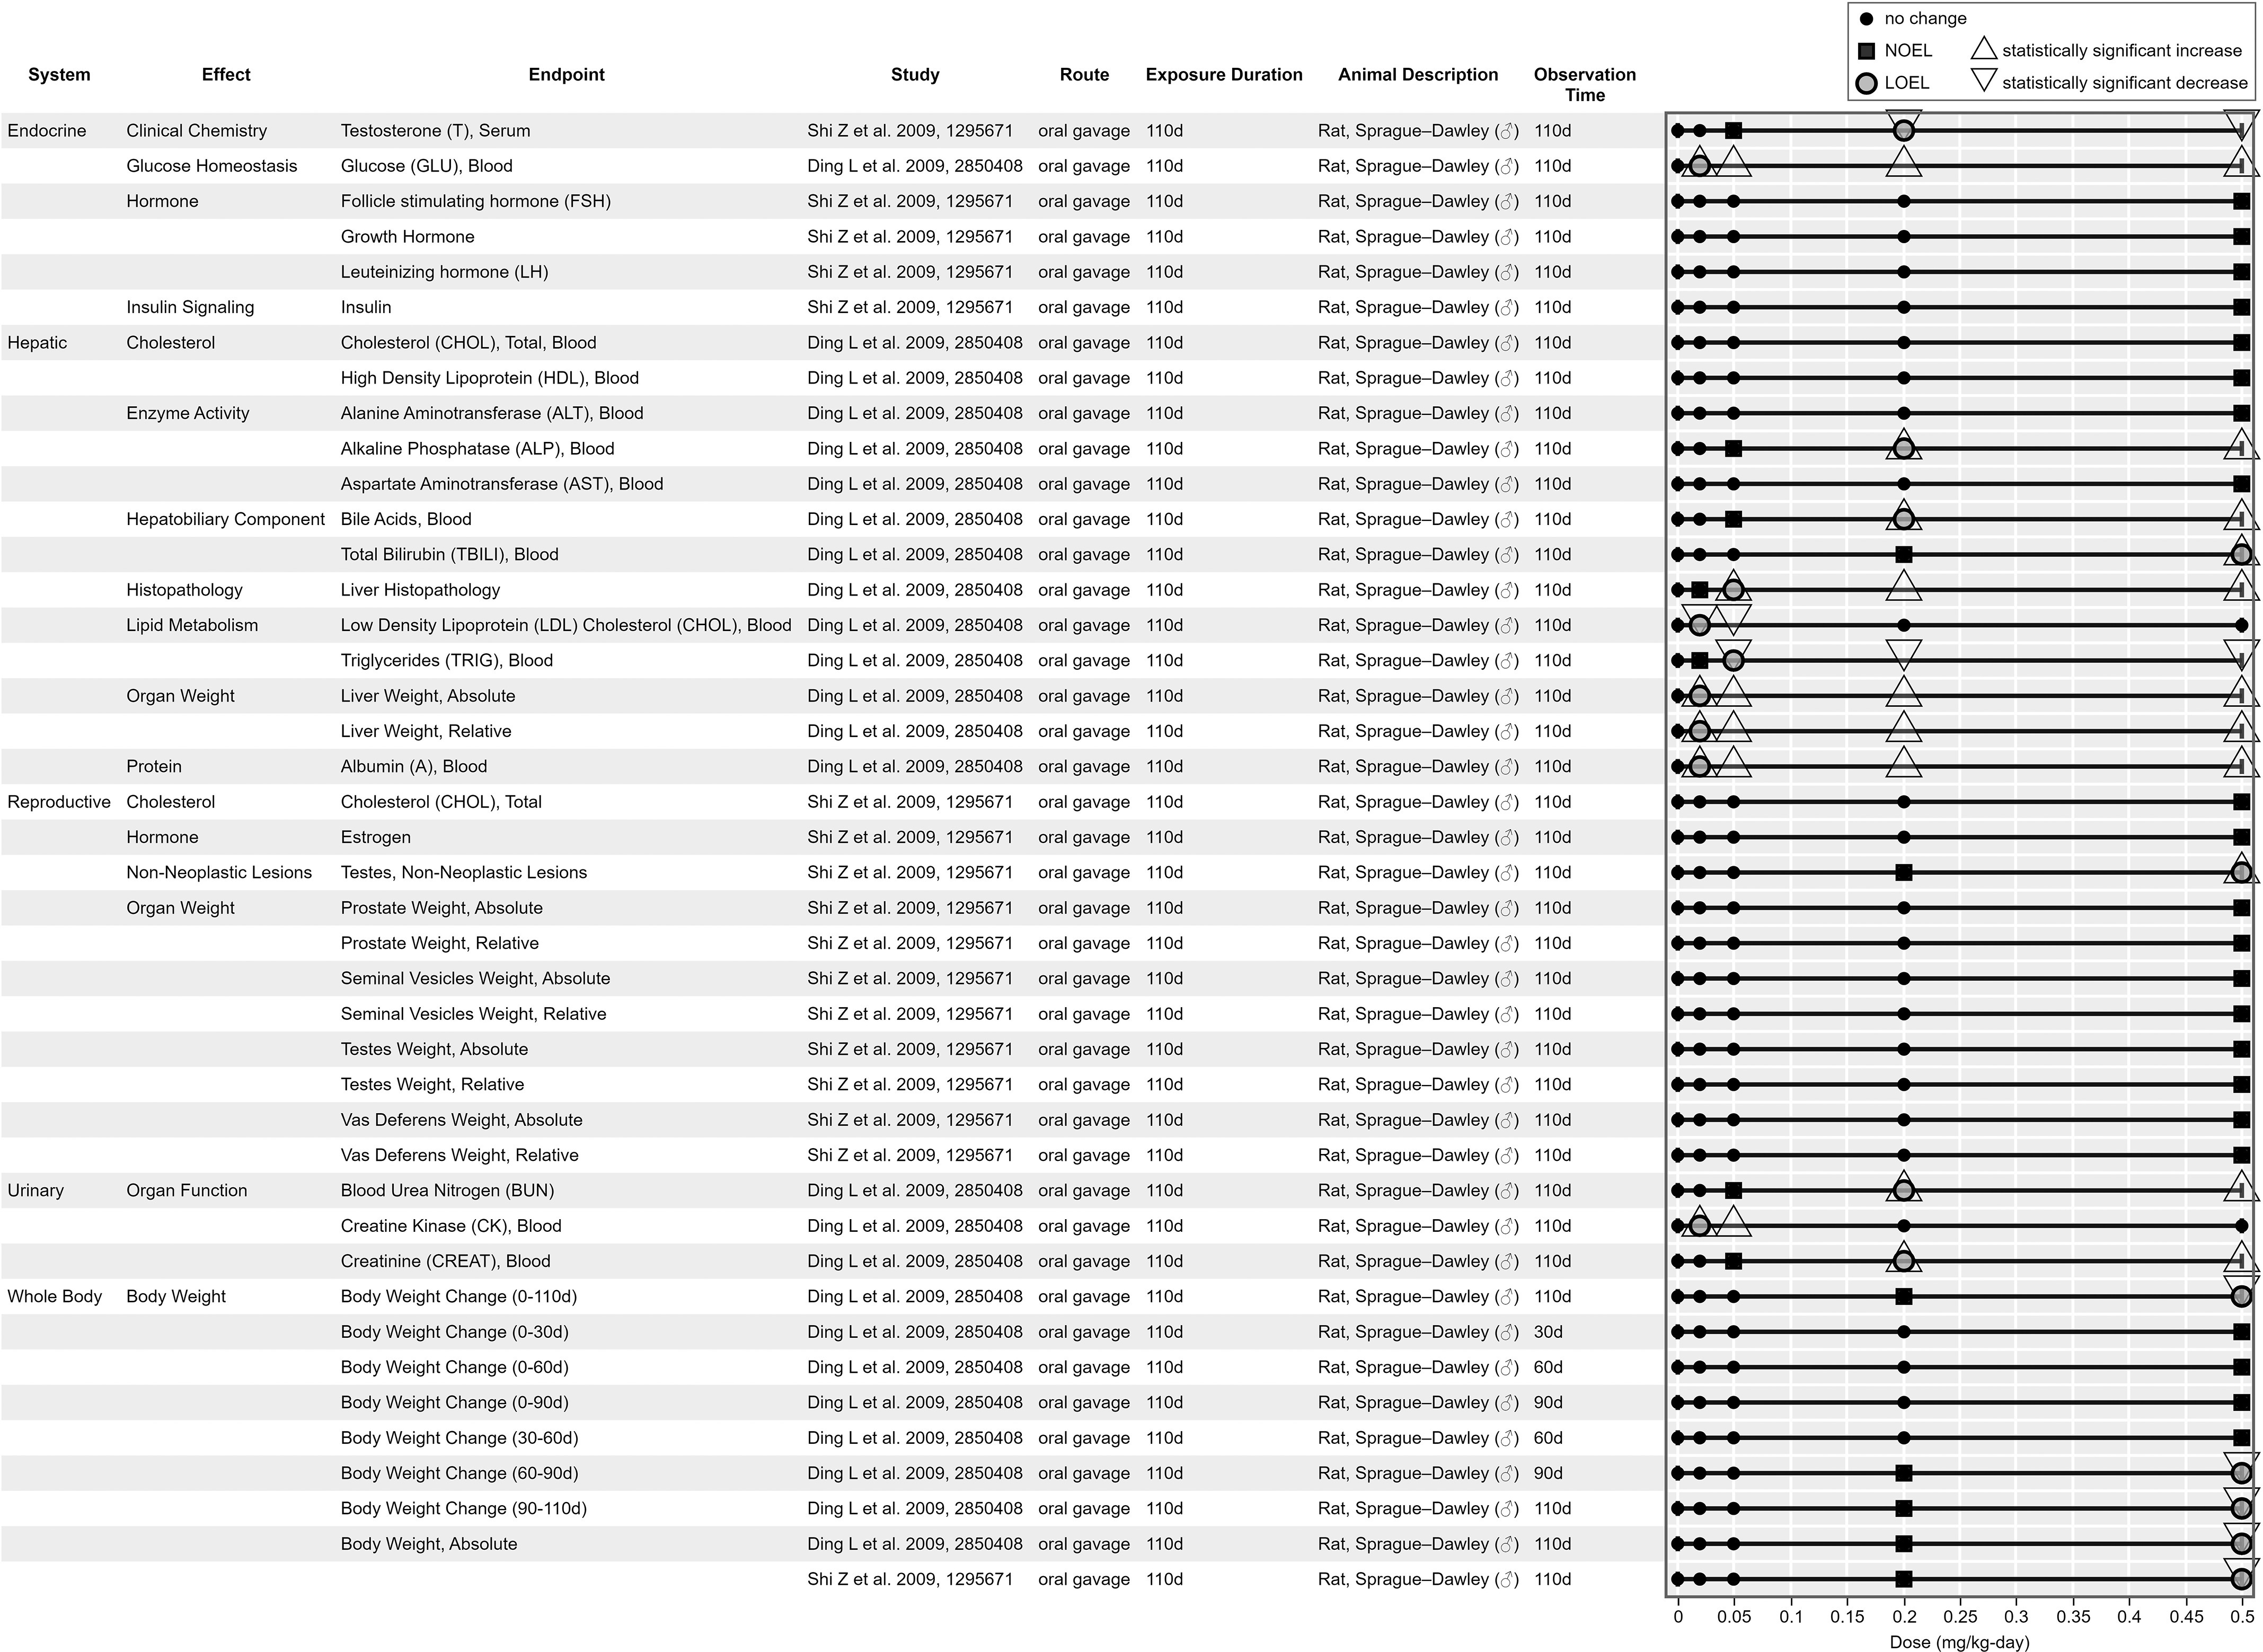
Figure 9 is a forest plot, plotting System, including effect, endpoint, ranging as Endocrine, including Clinical Chemistry and Testosterone (T), Serum; Glucose homeostasis and Glucose (G L U), blood; Hormone and follicle stimulating hormone (F S H), growth hormone, and luteinizing hormone (L H); and Insulin signaling; Hepatic, including cholesterol and cholesterol (C H O L), total, blood, high density lipoprotein (H D L), blood, Enzyme activity and Alanine aminotransferase (A L T), blood, Alkaline phosphatase (A L P), blood, Aspartate aminotransferase (A S T), blood, hepatobiliary component and bile acids, blood, total bilirubin (T B I L I), blood; Histopathology and Liver histopathology; Lipid metabolism and Low Density Lipoprotein (L D L) cholesterol (C H O L), blood and triglycerides (T R I G), blood; Organ weight and liver weight, absolute, liver weight, relative; Protein and Albumin (A), blood; Reproductive, including Cholesterol and cholesterol (C H O L), total, Hormone and estrogen, non-neoplastic lesions and testes, non-neoplastic lesions, Organ weight and prostate weight, absolute, prostate weight, relative, seminal vesicles weight, absolute, seminal vesicles weight, relative, testes weight, absolute, testes weight, relative, Vas deferens weight, absolute, vas deferens weight, relative; Urinary, including Organ function and blood urea nitrogen (B U N), creatine kinase (C K), blood, Creatine (C R E A T), blood; and Whole body, including body weight and body weight change (0 to 110 days), body weight change (0 to 30 days), body weight change (0 to 60 days), body weight change (0 to 90 days), body weight change (30 to 60 days), body weight change (60 to 90 days), body weight change (90 to 110 days), body weight absolute (y-axis) across dose (milligram per kilogram per day), ranging from 0 to 0.5 in increments of 0.05 (x-axis) for no change, N O E L, L O E L, statistically significant increase, and statistically significant decrease.

Survey of oral toxicology findings for perfluorododecanoic acid. This is a thumbnail image of the interactive visual (https://hawc.epa.gov/summary/data-pivot/assessment/100500256/Figure-21-Perfluorododecanoic-acid_OralChronic/) accessed on 3 November 2023.71 Data are also available in Excel Table S12 (filter by chemical name). Six-digit number in “study” column is Health and Environmental Research Online identification. Note: d, days; LOEL, lowest observed effect level; NOEL, no observed effect level.