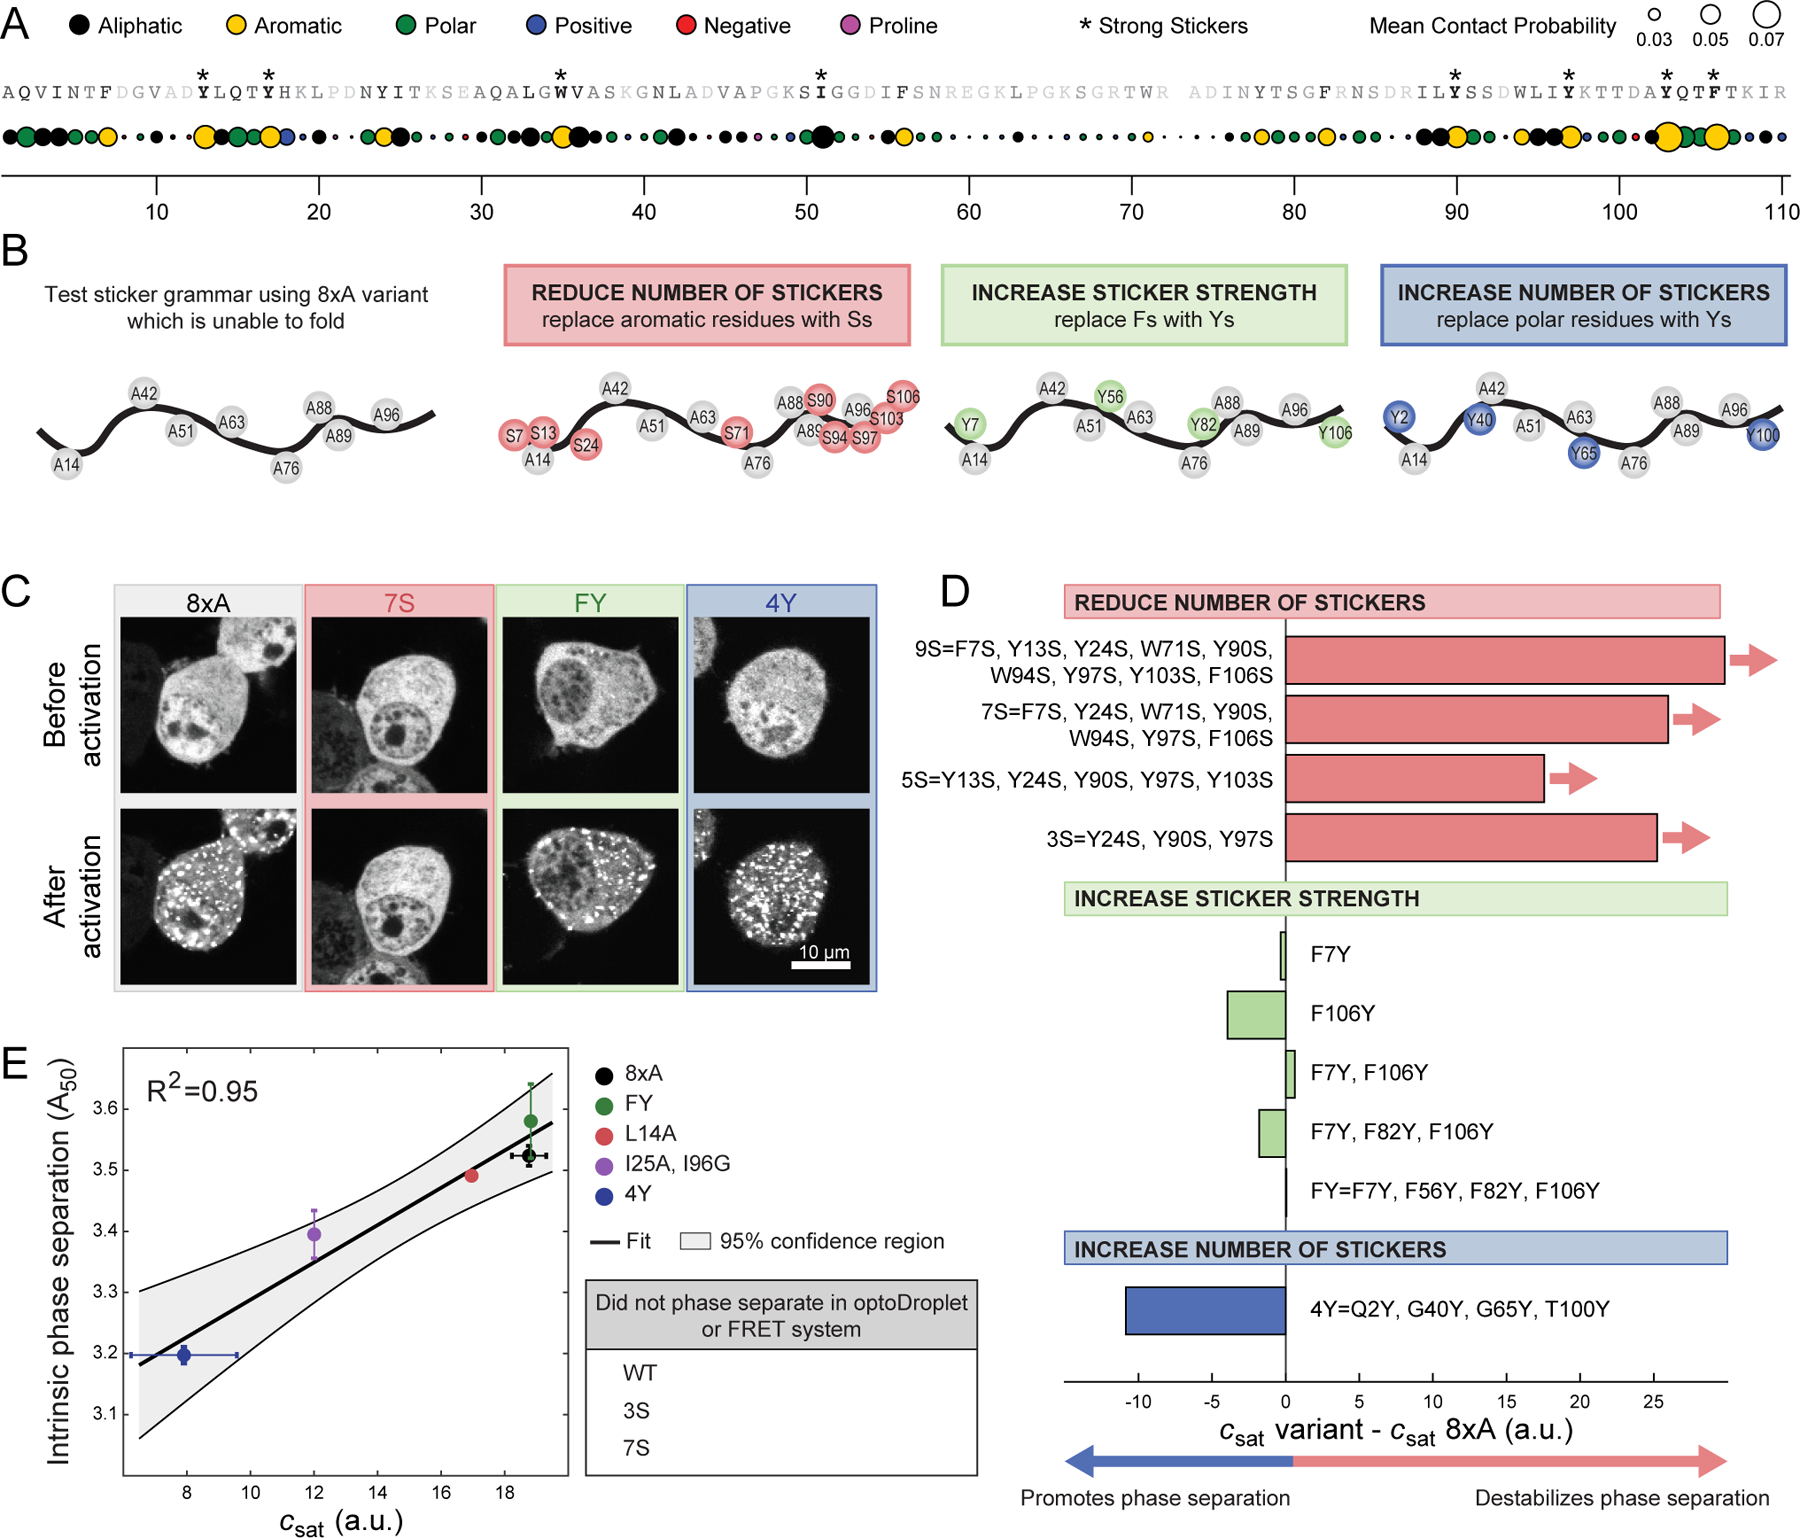
Figure 4. Phe and Tyr function as stickers that drive phase separation of unfolded barnase.

(A) Mean contact probability for each residue quantified from atomistic simulations of unfolded states of WT barnase. The WT sequence is listed across the top and each residue is shaded based on its mean contact probability. Residues highlighted by * denote strong stickers. Strong stickers are those residues that have a mean contact order greater than the maximum mean contact order from a Flory Random Coil simulation (STAR Methods). (B) Schematic of constructs used to test sticker grammar. In all cases, the base construct was 8×A, which has eight hydrophobic residues mutated to A (grey circles). Additional mutations used to test sticker grammar are shown in colored circles. Letters denote the residue the position is mutated to. (C) Representative confocal micrograph images of Neuro2a cells transfected with the sticker barnase-optoDroplet variant constructs. (D) Comparison of the csat values of each sticker barnase-optoDroplet variant construct with the csat of the 8×A construct, in arbitrary units. Bars with arrows indicate that a csat value could not be extracted for these constructs and must be at least above the value of the bar. (E) Comparison of the intrinsic phase separation of barnase as fusions to fluorescent proteins mTFP1 and Venus, using the A50 analysis, to csat values of barnase in the optoDroplet format (R2 = 0.95 for linear regression). Error bars indicate standard deviations. Also, see Figure S3 and Table S3.
