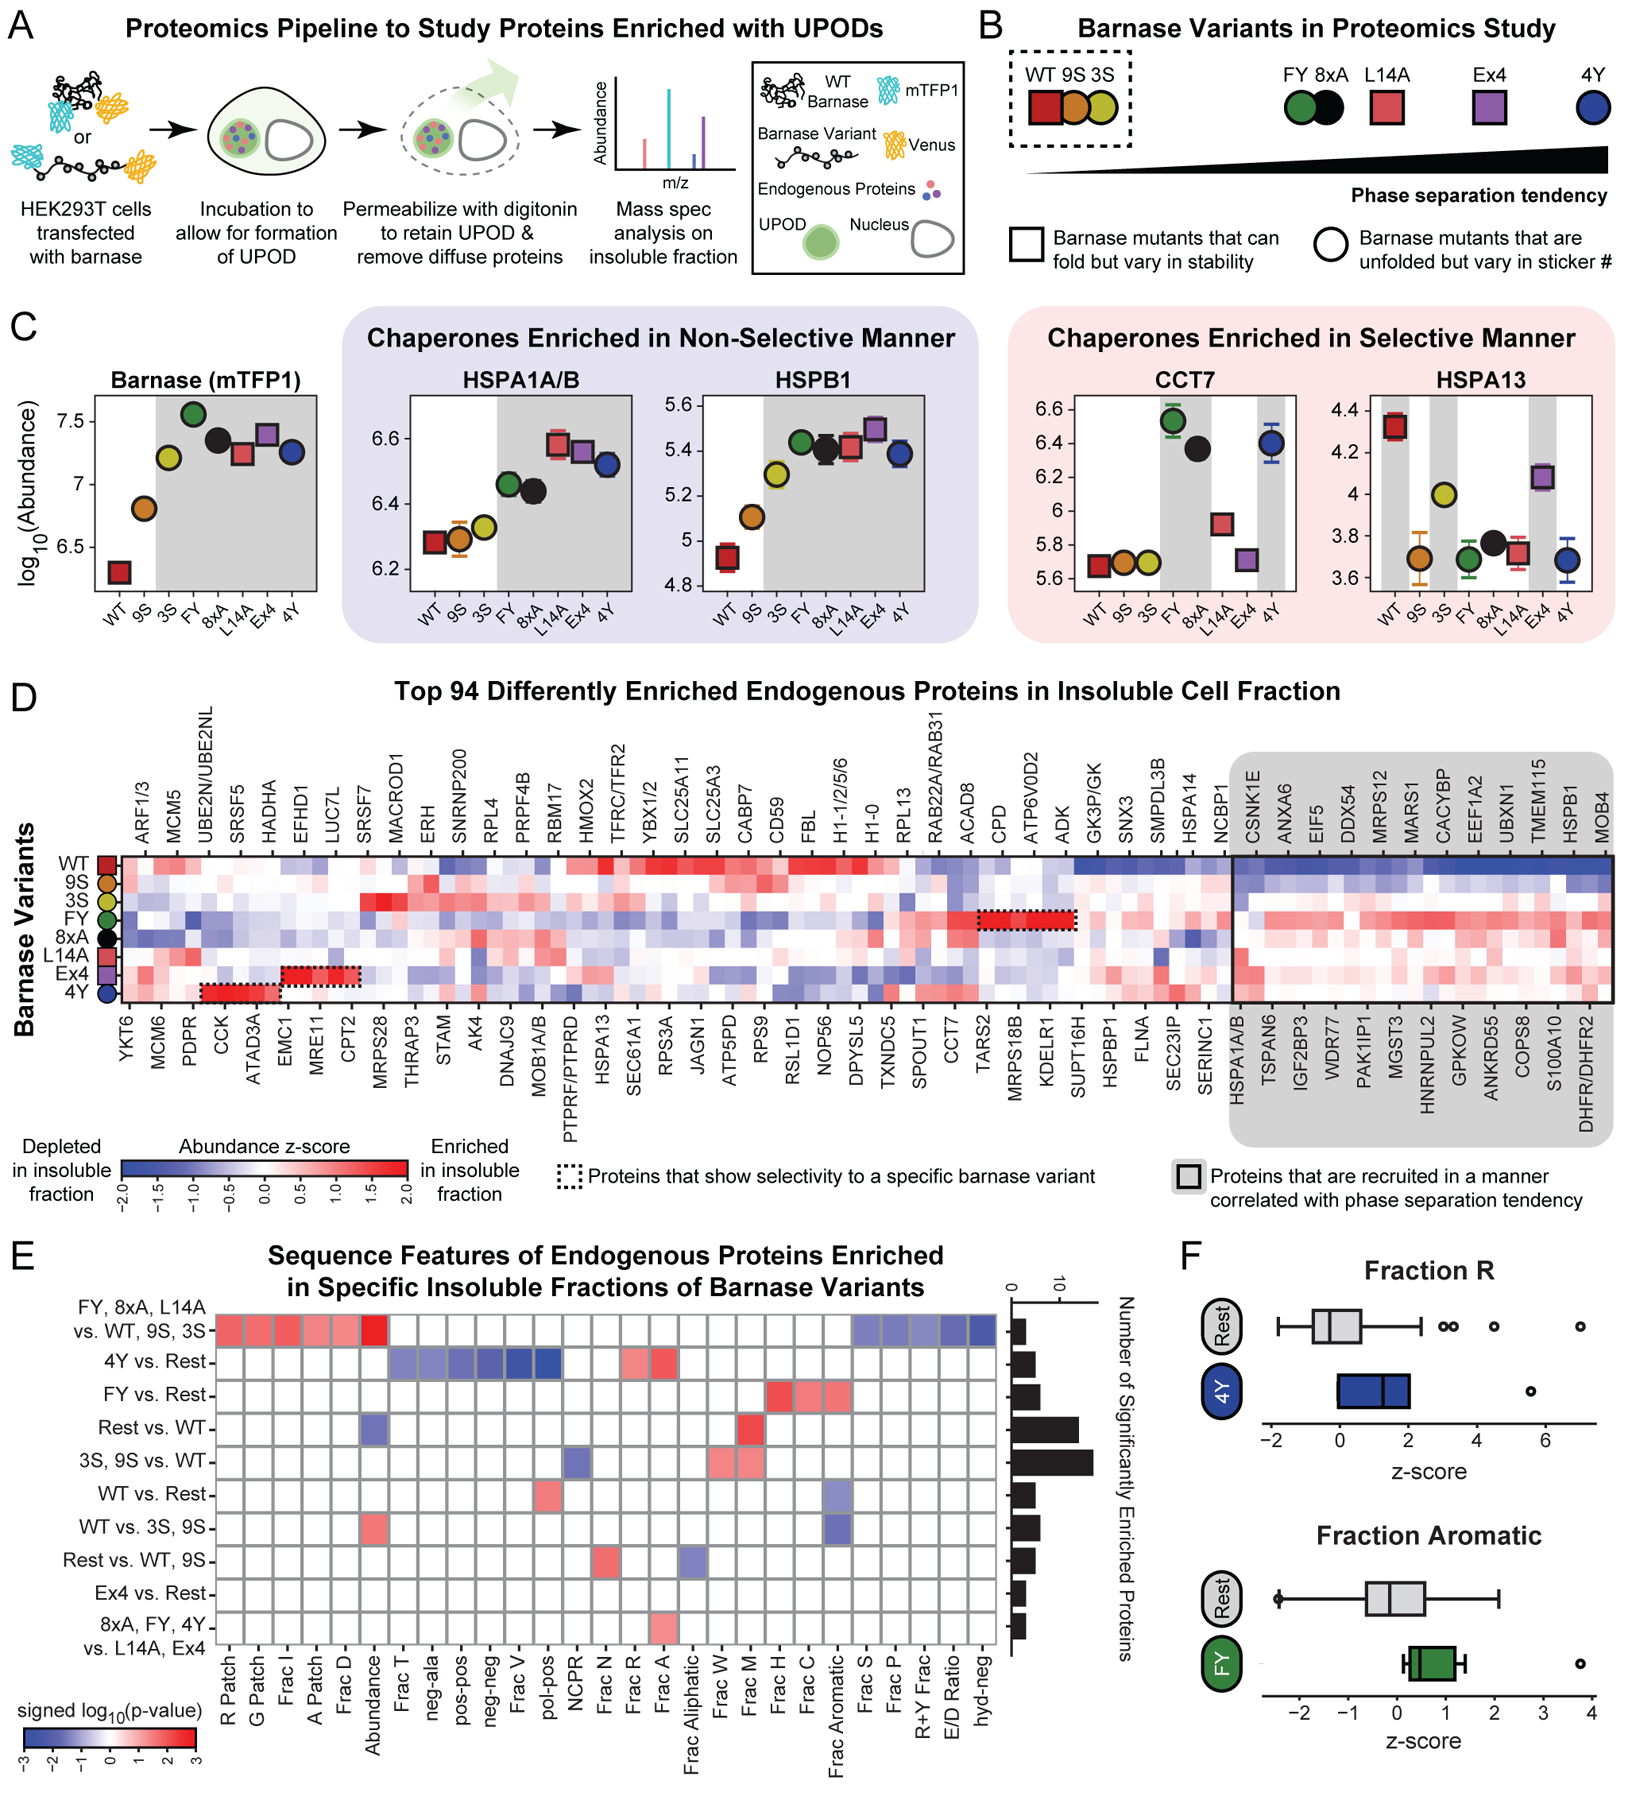
Figure 6: UPODs sequester and enrich cellular proteins through interactions governed by physical chemistry.

(A) Schematic of the proteomics workflow to extract compositional profiles of insoluble fractions of cells enriched with specific barnase variant UPODs. (B) Barnase variants used for the proteomics study vary in phase separation tendency (csat), stability (∆G˚U), and sticker composition. Variants within the dashed box were not found to phase separate at the concentrations tested. (C) Abundance of barnase (mTFP1) and four representative chaperones in barnase specific insoluble fractions. Barnase variants are sorted based on their phase separation tendency. Selectivity refers to recruitment not correlated with the phase separation tendency of the barnase variants. Shaded gray regions denote the UPODs the given protein is significantly enriched in as determined by the Fisher’s LSD test following an ANOVA test. Error bars denote the standard error of the mean of four replicates. (D) Smoothed abundance z-score matrix for the top 94 differently enriched proteins in the insoluble fractions (Cox et al., 2022). Here, the z-score was calculated using the mean and standard deviation of all replicas and all barnase variants for a given endogenous protein. Proteins were hierarchically clustered using the Euclidean distance and Ward linkage method. The 24 proteins highlighted in grey are those that were recruited in a manner correlated with the phase separation tendency of the barnase variant. (E) Significant sequence features in different protein sets. The given set of proteins were significantly enriched in the insoluble fractions of barnase variants to the left of “vs.” compared to the barnase variants to the right of “vs.” (STAR Methods). Here, “Rest” refers to all remaining barnase variants. Features come in three types: patterning, composition, or abundance (STAR Methods). Blue boxes denote either compositional features / abundance that are significantly depleted or patterning features that are well-mixed in the given protein set. Red boxes denote either compositional features / abundance that are significantly enriched or patterning features that are blocky in the given protein set. Significance is determined by using the two-sample Kolmogorov-Smirnov test on the z-score feature distribution of the given protein set compared to the z-score feature distribution of the remaining top 94 proteins. Bar chart shows the number of significantly enriched proteins in each set. (F) Boxplots of the z-scores of the fraction of Arg in proteins significantly enriched in the 4Y insoluble fraction vs. Rest and fraction of aromatics in proteins significantly enriched in the FY insoluble fraction vs. Rest. Grey boxplots denote the z-scores of the remaining top 94 differently enriched proteins in each case. See also Figure S5 and Table S5.
