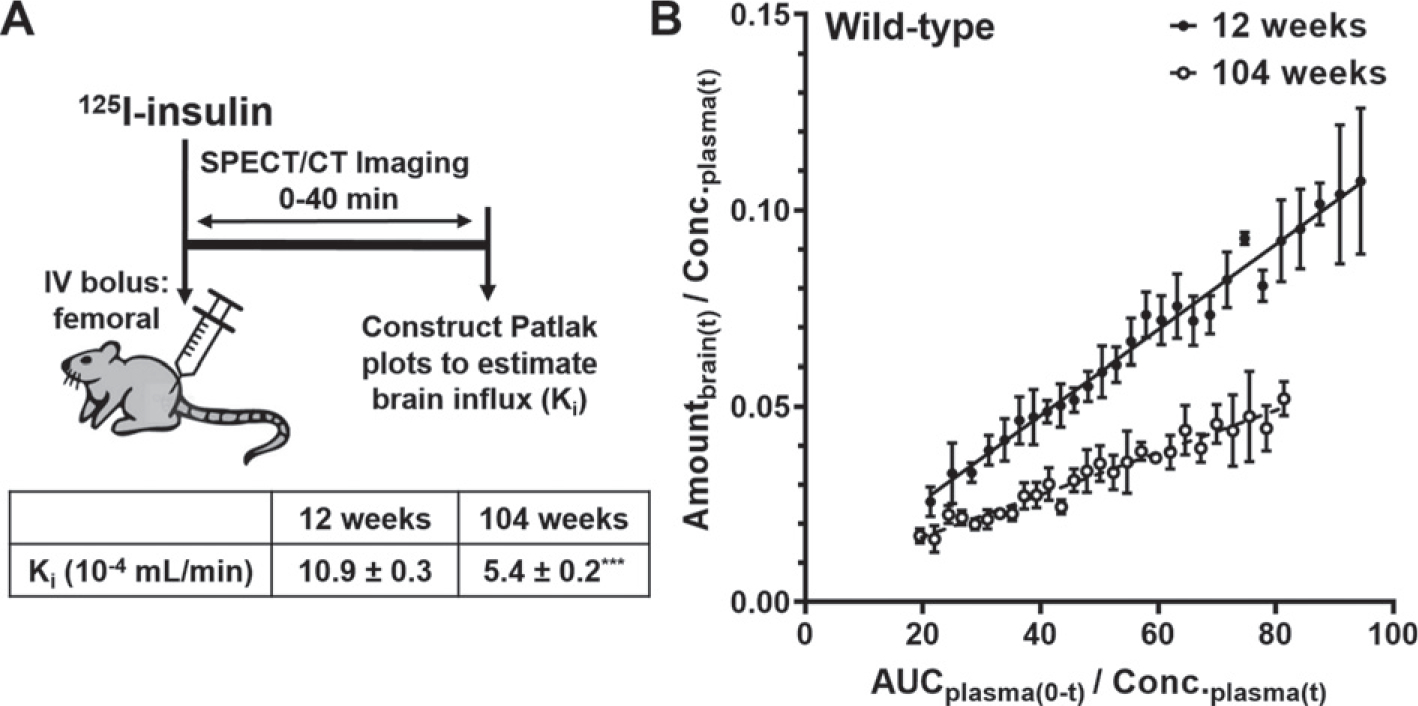
Fig. 5.

Dynamic SPECT/CT imaging of 125I-insulin uptake to the brain. A) Experimental scheme. WT mice were bolus injected with 500μCi of 125I-insulin into the femoral vein and the accumulation of 125I-insulin in the brain was monitored between 0–40 minutes post-injection by dynamic SPECT/CT imaging. B) The brain influx clearance (Ki) of 125I-insulin was estimated by the slope obtained from Gjedde-Patlak graphical analysis. In the graph, Amountbrain(t) is the measured radioactivity in the brain ROI (Ci) at each time point (data are mean±SD, n=4), whereas AUCplasma(0-t) (min.μCi/mL) and Conc.plasma(t) (μCi/mL) were predicted using the plasma pharmacokinetic parameters. The Ki predictions presented in the table are mean±SE, n=4. ***p<0.001; unpaired two-tailed t-test.
