Fig. 4.

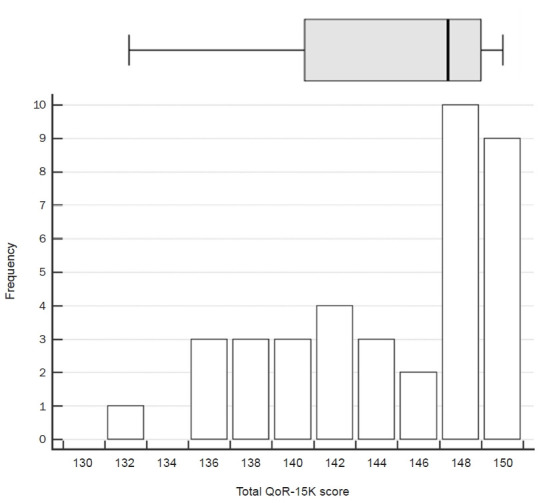
Box-and-whisker plot and histogram of the 15-item Quality of Recovery (QoR-15K) total score. Right and left whiskers denote maximum and minimum values excluding outliers, respectively.

Box-and-whisker plot and histogram of the 15-item Quality of Recovery (QoR-15K) total score. Right and left whiskers denote maximum and minimum values excluding outliers, respectively.