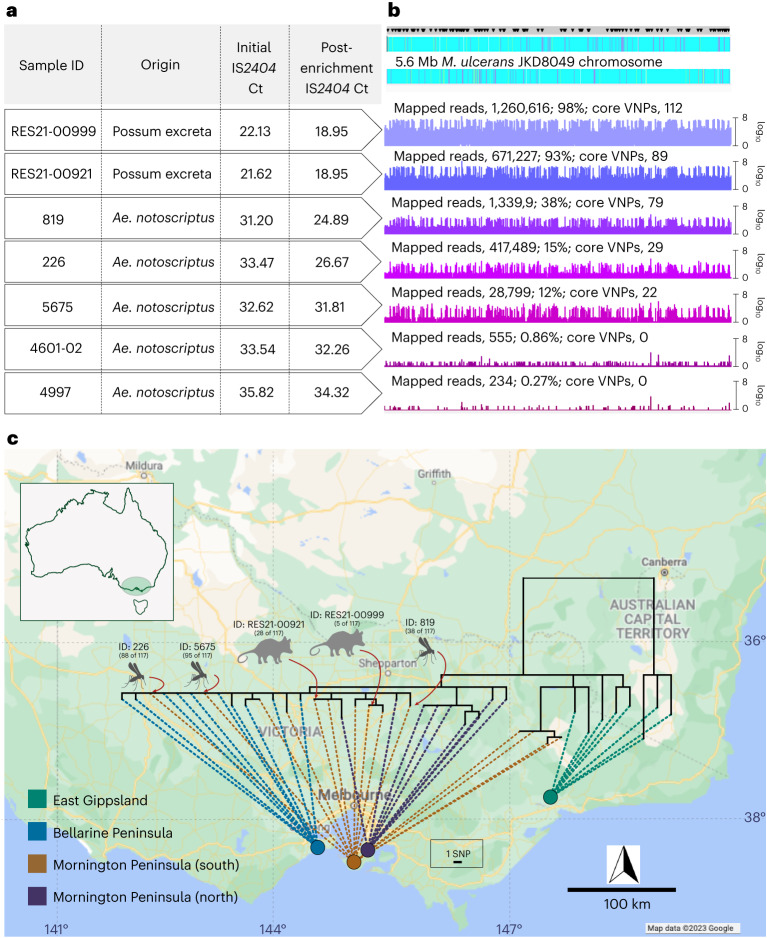
Fig. 2. M. ulcerans genome from human Buruli ulcer cases compared with sequences recovered from possum excreta and mosquitoes on the Mornington Peninsula.
a, Summary of IS2404 qPCR screening of primary samples and the sequence-capture libraries pre- and post-enrichment. Note that possum excreta were enriched as barcoded sequence library pools so they share the same pre- and post-enrichment Ct values. b, Artemis coverage plots depicting sequence-capture reads mapped to the M. ulcerans JKD8409 chromosome from possum excreta samples and three qPCR-positive mosquitoes (labels are given as numbers of mapped reads; percentage of total chromosome bases mapped; number of core variable nucleotide positions (VNPs) covered). The grey horizontal bar above the chromosome map shows the sites of 117 core SNPs (black inverted triangles). c, Maximum likelihood phylogeny inferred from an alignment of 117 core genome SNPs using reads mapped to the JKD8049 reference chromosome, and with tips aligned with environmental sample origin or patient origin. The dataset includes reads from the 5 environmental samples listed in a with >21 VNPs, and a reference collection of 36 M. ulcerans genomes representing the genomic diversity of the M. ulcerans population in southeastern Australia24. The shortest vertical branch length represents a single SNP difference, as per the scale bar. Map boundaries in c from Google Maps under a Creative Commons license CC BY 4.0.

