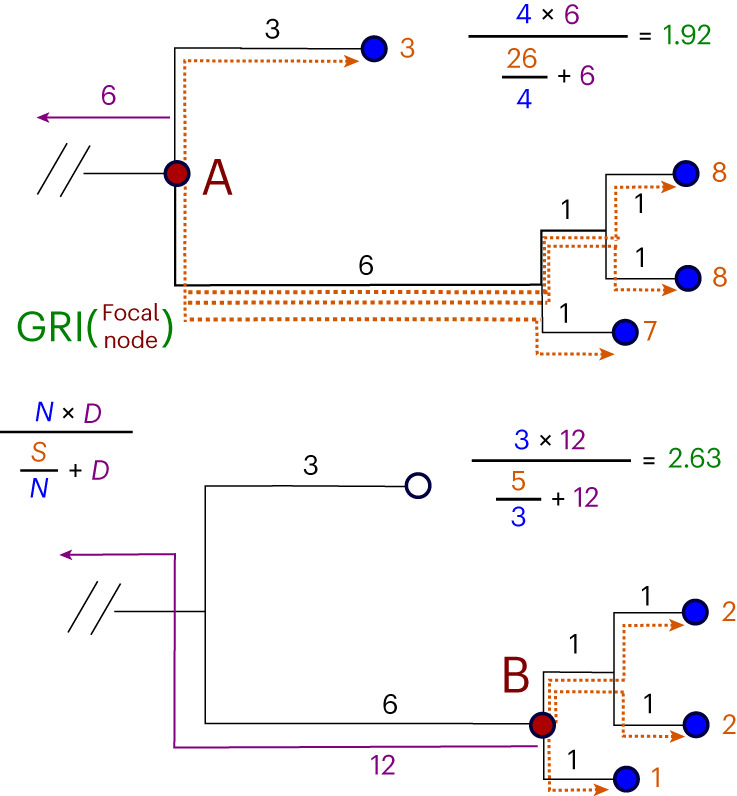
Fig. 1. Computation of GRI.

The computation of GRI values for two nodes on a small example subtree. The top panel shows the computation for node A, while the bottom panel shows the computation for node B. The base of this subtree is a total distance of 6 from the last lineage root, shown in purple. The node at the base of this subtree (A) has a total path length to descendents (S) of 26 and 4 total descendents (N), and is a total distance of 6 from the last root (D), leading to a GRI of 1.92. The lower child node (B) has only 3 descendents (N), but has a much lower path length (S) and a longer distance to the last root (D), meaning that it scores much higher at 2.63. In this case, we would choose to assign a lineage label to the lower child node (B).
