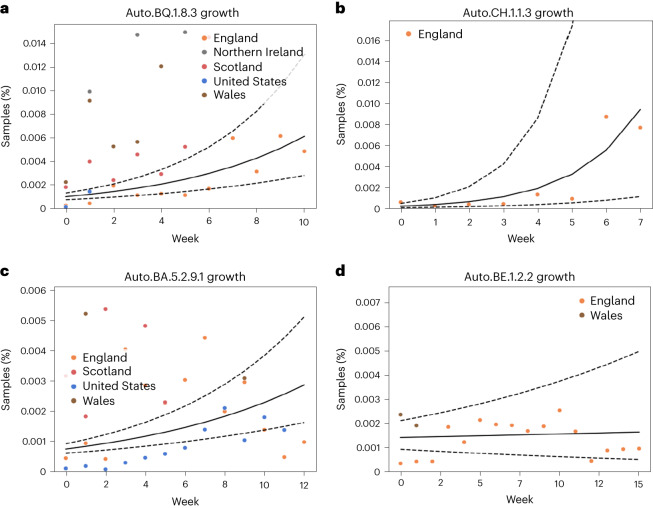
Fig. 2. Exponential growth modelling.
a–d, The four plots describe some of the lineage annotations produced by our method based on the public SARS-CoV-2 data. The solid black line is the median estimated growth trajectory, while the dashed lines represent the trajectories that would result from the lower and upper bounds of the 95% credible interval of the growth rate. The x-axis shows the weeks since first detection in each country. a, Growth trend of a lineage throughout the United Kingdom with a notably higher presence in Wales. b, Simple, high but low-certainty growth estimate of a lineage exclusive to England. c, Steady growth of an international lineage present in both the United Kingdom and the United States. d, A lineage which appears to have stagnated in growth and should be deprioritized for lineage labelling.

