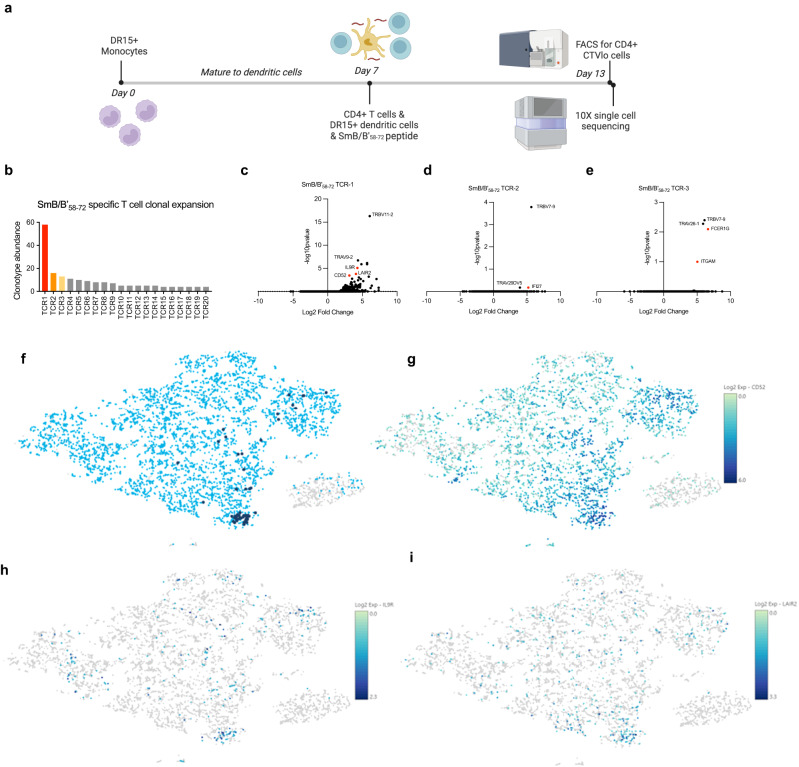
Fig. 5. Single-cell RNA sequencing reveals SmB/B’58-72-specific CD4+ T cells.
a Experimental timeline of single-cell sequencing experiment from co-culture of cells with the peptide of interest to sorting of cells for sequencing. Created with BioRender.com. b Clonotype numbers of the top 20 SmB/B’58-72-specific TCRs (TCR1 to TCR20) as identified using 10X V(D)J single T-cell sequencing. c–e Volcano plot of genes expressed by CD4+ T cells of interest that express SmB/B’58-72-TCR1-3. P values are derived from a negative binomial exact test with adjustment using Benjamin Hochberg correction for multiple tests. f t-SNE plot of CD4+ T cells that express our TCR of interest, TCR1 (dark blue dots). The majority of the cells expressing this TCR are clustered close together, indicating they are clonally expanded sharing a similar gene expression profile. g t-SNE plot of CD52 expression, a marker of suppressor T cells. The majority of CD52hi cells are clustered towards the bottom of the plot where cells expressing our TCR1 of interest are. h t-SNE plot of IL9R expression clustered with TCR1 expression. i t-SNE plot of LAIR2 expression clustered with TCR1 expression. Source data are provided as a Source Data file.

