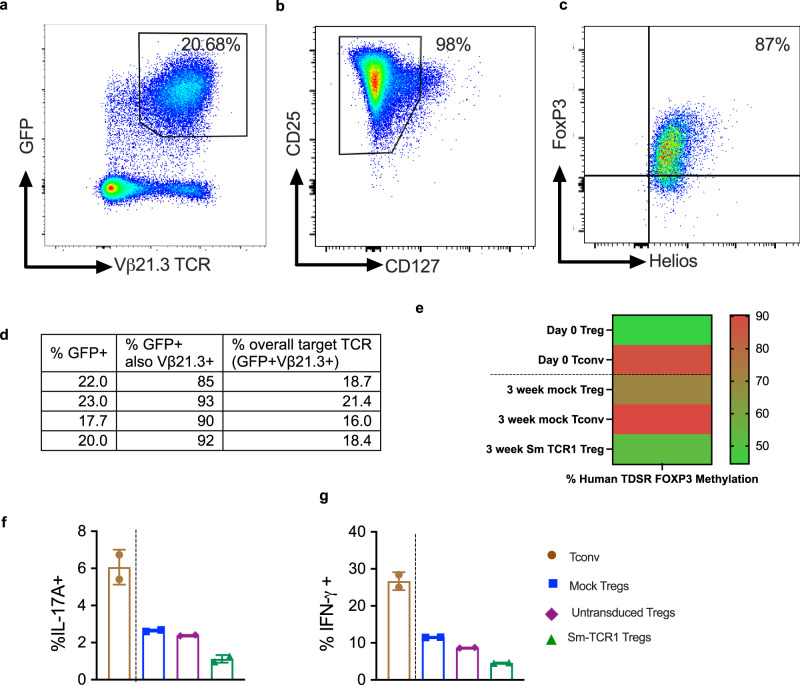
Fig. 7. Sm-Tregs are phenotypically stable.
Healthy human Tregs were transduced with TCR1 and expanded 10 days in vitro. a Representative flow cytometry dot plot of the CD4+ Treg cells expressing GFP and TCR Vβ21.3, the antibody specific for the variable gene TRBV11-2 of TCR1 showing a mean co-expression of 20.68%. b Treg surface marker phenotype by representative dot plots of CD25 and CD127 expression on CD4+ cells. c Sm-Treg transcription factor phenotype by representative dot plots of forkhead box P3 (FOXP3) and Helios expression. d Treg expression of GFP and Vβ21.3 by flow cytometry from four separate experiments on healthy donor Tregs. e methylation of the Treg-cell specific demethylated region (TDSR) of the FOXP3 locus of Treg and Tconv cells at day 0 (before transduction and expansion) and 3 weeks after transduction and expansion. f, g IL-17A and IFN-γ expression after stimulation with PMA and ionomycin of Tconv (brown), mock-transduced Tregs (blue), the un-transduced (GFP-) portion of Tregs that underwent lentiviral transduction (purple) and Sm-TCR1-transduced Tregs after 10 days of expansion culture in vitro, measured by intracellular flow cytometry (n = 2 biologically independent samples), data are presented as mean with SD. Source data are provided as a Source Data file.

