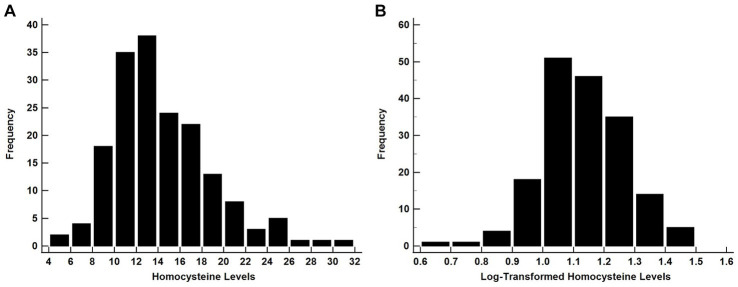
Figure 1.
The histograms showing the distribution of raw A and B log-transformed Homocysteine values. Since the raw data are right-skewed, the log-transformed data yielded a Gaussian-like distribution allowing for the use of for parametric test. Homocysteine data are from Malek-Ahmadi et al. (2013).

