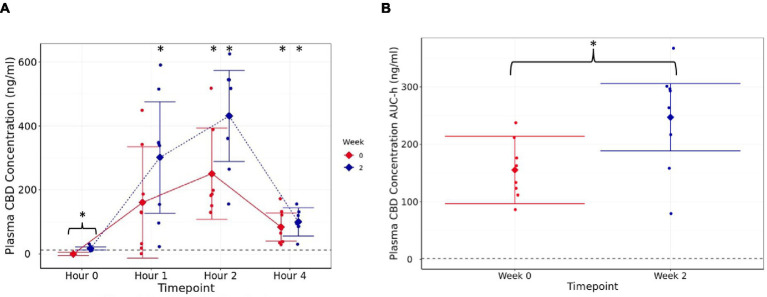
Figure 1.
Plasma CBD concentration (ng/mL) (A) estimated means with 95% confidence intervals, at h 0 (fasted baseline), h 1, 2, and 4 measured at week 0 (d0, first supplement of 4 mg/kg BW, solid line) and week 2 (after 14 days of daily supplementation at 4 mg/kg BW, dotted line), (B) area under the curve (per hour) over the 4-h pharmacokinetic period for each timepoint (weeks). Dashed line shows limit of detection. * shows difference between the post-dose timepoint, and h 0 is statistically significant. The presence of a “}” in addition indicates the difference is between week 0 and week 2.

