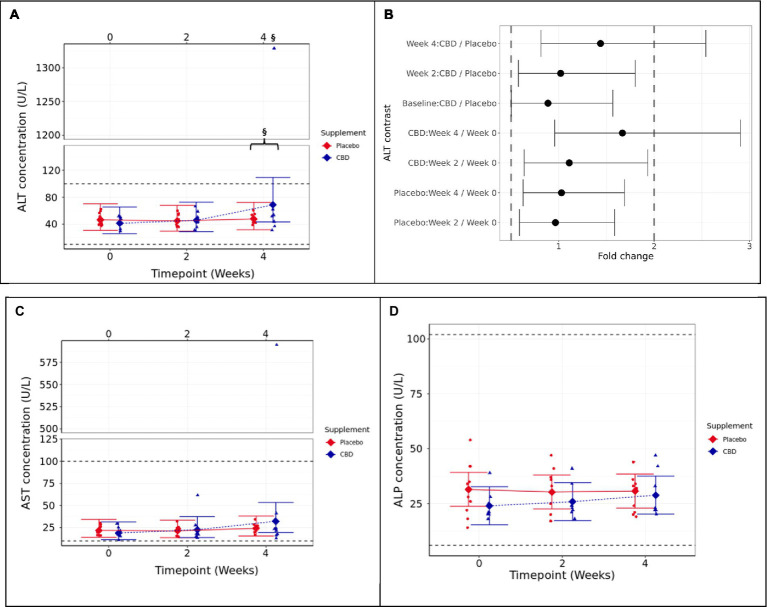
Figure 2.
Means and 95% confidence intervals (C.I.) for fasted plasma measures over the 4-week study (A) ALT (U/L), (B) two one-sided test (TOST) fold change contrast plot, (C) AST (U/L), and (D) ALP (U/L). § indicates that equivalence between the timepoint and week 0 is not supported (p ≥ 0.05). The presence of a “}” in addition indicates non-equivalence between CBD treatment and placebo groups. Reference ranges included as dashed horizontal lines across the figure. TOST thresholds are shown with dashed vertical lines. Statistical equivalence is indicated by CIs falling entirely within these bounds (true for all contrasts except Week 4: CBD vs. Placebo, and CBD: Week 4 vs. 0). Statistical difference is indicated by CIs falling entirely to the left or right of 1 fold change. Liver health parameters.

