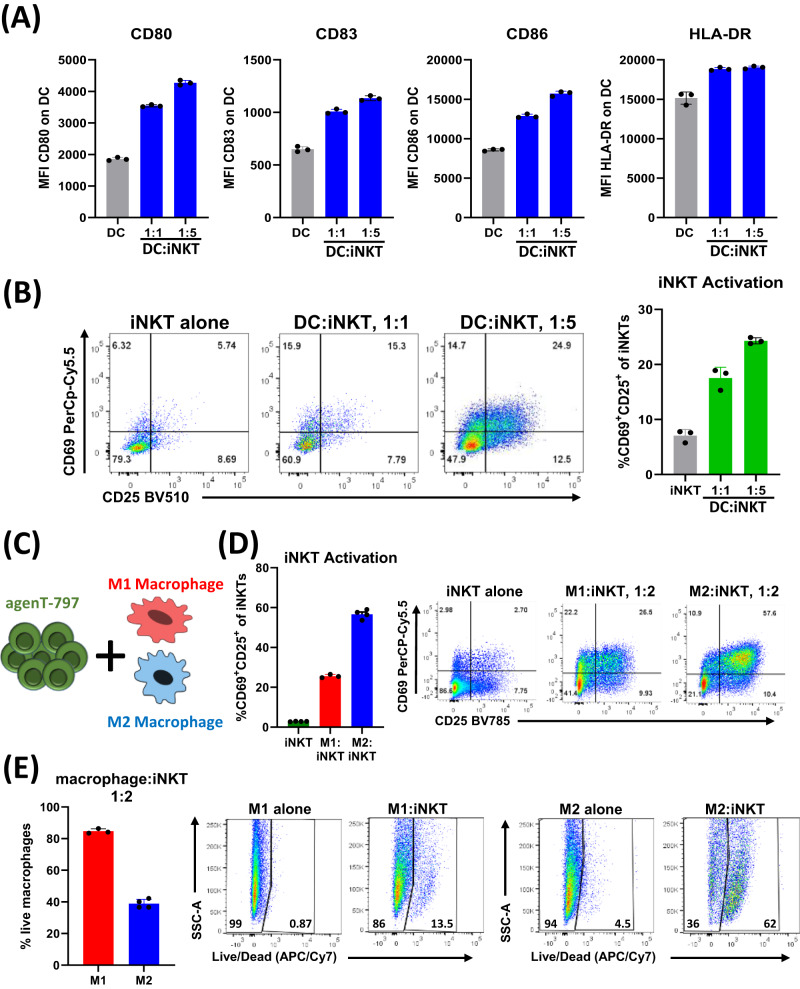
Fig. 6. Cross talk between agenT-797 and the myeloid cell compartment.
A, B DCs were cocultured with agenT-797 cells at 1:1 and 1:5 DC to iNKT ratio for 48 h. DC and iNKT activation was measured by flow cytometry. Data shown is representative from one donor. A Expression of DC activation markers CD80, CD83, CD86 and HLA-DR on DCs cultured alone (gray bars) or with iNKT cells (blue bars; n = 3). B Evaluation of iNKT activation from DC co-cultures by co-expression of CD25 and CD69 (n = 3; iNKT alone: gray bars; coculture: green bars). C–E M1 and M2 macrophages were cocultured with agenT-797 at 1:2 ratio for 48 hr as shown in schematic (C). Data shown is representative from one donor. D iNKT (agenT-797) activation following macrophage coculture as measured by surface expression of CD69 and CD25. agenT-797 alone (green; n = 4) or cocultured with M1 (red; n = 3) or M2 (blue; n = 4) macrophages. Representative flow chart shown on left. E Frequency of viable macrophage following coculture of iNKT cells with M1 (n = 3) or M2 (n = 4) macrophages as measured by live/dead staining. Representative flow chart shown on left. All bar charts represent mean with SD.

