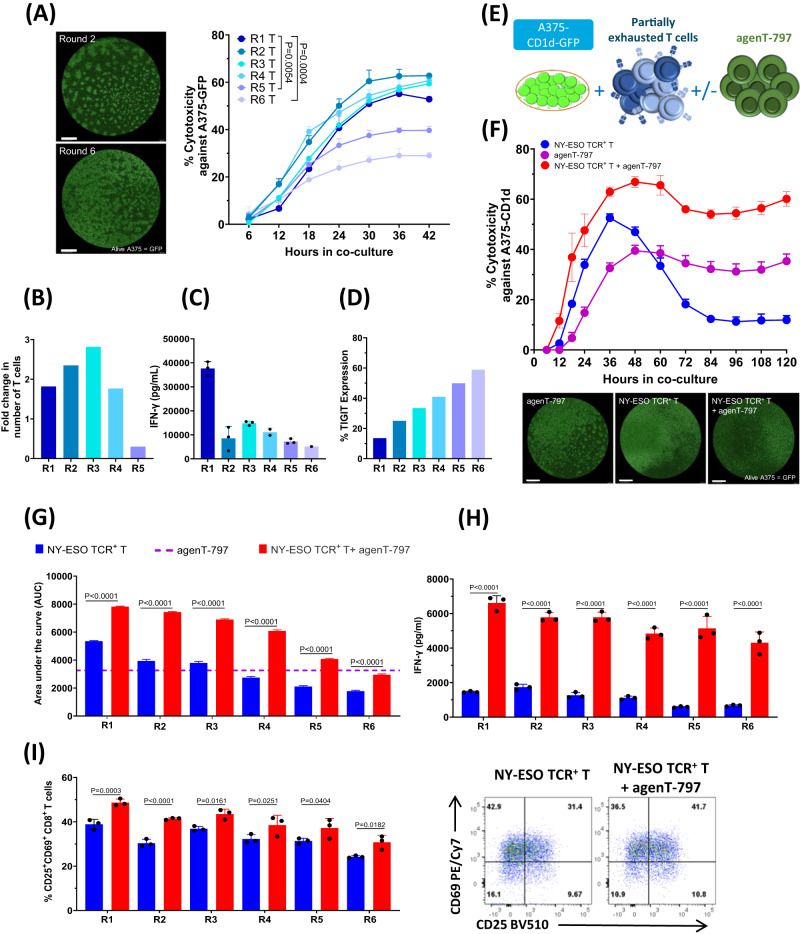
Fig. 7. Reversal of partial T cell exhaustion by agenT-797.
A Cytotoxicity of NY-ESO TCR + T cells against A375-GFP cells was assessed using Incucyte Live Imaging (representative images after 48 h of co-culture; scalebar: 1 mm). Significant differences in killing curves between single-time antigen-exposed (Round 1; R1) and multiple-times antigen-exposed (R5, R6) T cells became apparent after 30 h of coculture. Adjusted P values shown for data from 30 h timepoint. Data analysed by 2-way ANOVA followed by Dunnett’s multiple comparison test. Datapoints represent mean with SD (n = 3 replicate wells). B T-cell proliferation (fold change) during each round of antigen exposure (n = 1 experiment). C IFN-γ measurement in supernatants after each round of antigen exposure of T cells. Bars represent mean with SD (n = 3). D Expression of TIGIT in CD8 + T cells evaluated as a marker of exhaustion in every round of exposure. Data shown is representative from one donor. E–I NY-ESO TCR + T cells from different rounds of antigen exposure were co-cultured with A375-CD1d-GFP target cells in presence or absence agenT-797 cells at the ratio of 1:1:1 as shown in the schematic in (E). F Impact of agenT-797 on killing curve of Round 4 (R4) antigen-exposed T cells. Datapoints represent mean with SD (n = 3). Sample images from end of experiment (scalebar: 1 mm). G Impact of agenT-797 on cytotoxic capacity (area under the curve; AUC) of T cells with 1–6 rounds of prior antigen-exposure (R1-R6). Bars represent mean with SEM (n = 3). H Impact of agent-797 in IFN-γ release in supernatants from antigen-exposed T cells (R1-R6). Bars represent mean with SD (n = 3). I Impact of agenT-797 on activation of antigen-exposed CD8 T cells (R1-R6) as measured by CD25 and CD69 expression. Bars represent mean with SD (n = 3). Flow panels: Impact of agent-797 on expression of activation markers (CD69 + CD25 + ) on Round 4 (R4) antigen-exposed T cells. H, I For each set of antigen-exposed T cells (R1-R6), mean values of respective T cell response (cytotoxicity AUC, IFN-γ release, CD25/69 expression) in absence or presence of agenT-797 were compared by Šídák’s multiple comparison test. P values adjusted for multiple comparisons. Colors as in (G).

