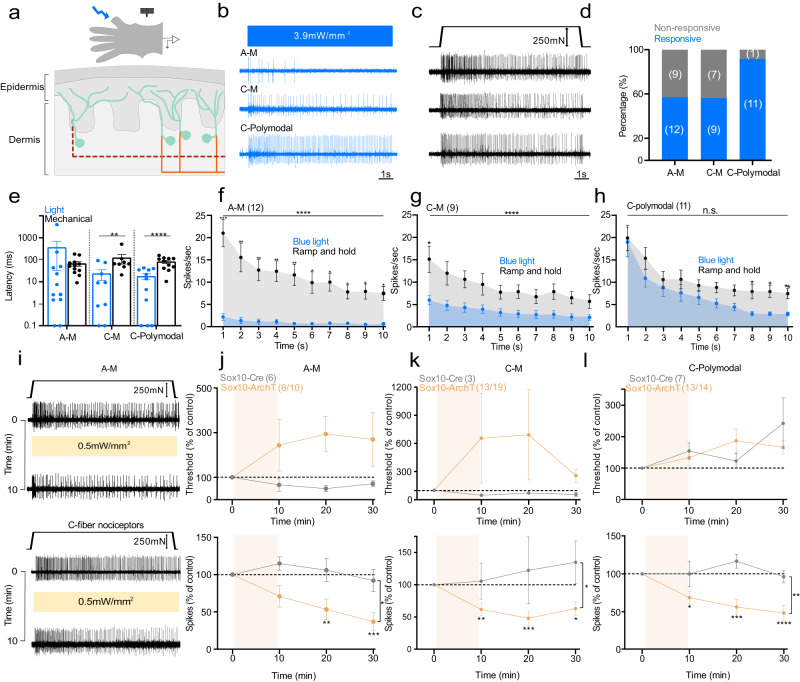
Fig. 1. Nociceptive Sox10+ Schwann cells are required for nociceptor mechanosensitivity.
a Schematic diagram of ex vivo preparation used to stimulate nociceptive Schwann cells with light. b, c Example traces of nociceptor types recorded. b Activity was recorded after blue light stimulation. c Spiking of the same nociceptor as in b to mechanical ramp and hold stimulation (10 s). d Proportion of nociceptors responding to blue light. e Latency of response to blue light compared to mechanical ramp and hold stimuli (AMs n = 12, C-M n = 9, C-polymodal n = 11) *P = 0.015, ***P = 0.0052, Mann–Whitney two tailed U-test. f–h Mean time course of nociceptor activation (1 s bins, 10 s, 250 mN amplitude ramp and hold stimulus), A-Mechano-nociceptors (AM n = 12) (f), C-mechano-nociceptors (C-M n = 9) (g), and polymodal C-fibers with thermal and mechanosensitivity (n = 11) (h). Mean spiking rates of the same receptors to blue light (blue) and mechanical stimuli (gray). ****P < 0.001 two-way ANOVA. i Representative traces show A-M and C-fiber mechanonociceptor activity to mechanical stimuli 10 s (ramp and hold) before and after 10 min of yellow light (i). j A-M-nociceptors threshold (upper panel) and spiking rates (lower panel) to mechanical stimuli before and after yellow light in Sox10-ArchT mice (n = 6) and in Sox10-Cre control (n = 6) animals (two-way ANOVA, P = 0.020, Bonferroni’s multiple comparison test). k C-mechano nociceptors (C-M) threshold and spiking rates to mechanical stimuli before and after yellow light in Sox10-ArchT (n = 13) and control mice (n = 3). l Polymodal C-fibers response to mechanical stimuli before and after yellow light in Sox10-ArchT (n = 13) and control (n = 7) mice (two-way ANOVA, P < 0.001, Bonferroni’s multiple comparison test). Data are presented as mean values ± s.e.m. Source data are provided as a Source Data file.

