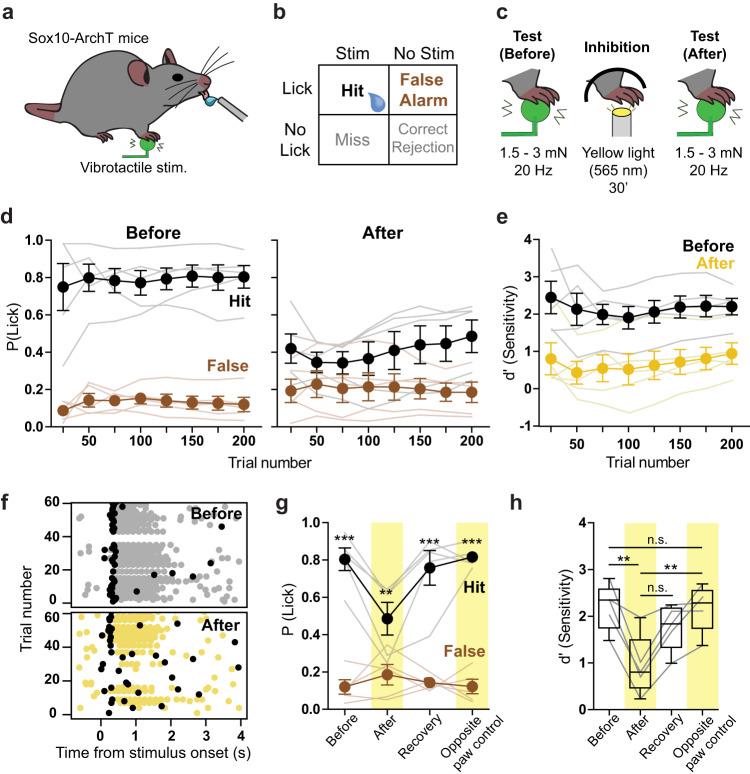
Fig. 6. Reduction of vibrotactile perception following optogenetic inhibition of forepaw Sox10+ cells.
a Cartoon schematic showing behavioral setup with right forepaw placed on a vibrotactile stimulator. b Structure of the Go/No Go behavioral task. During stimulus trials, mouse licks with a 400 ms window of opportunity following stimulus onset were rewarded and classified as hits. During no stimulus trials, licks in the same window were recorded as false alarms. The proportion of hits and false alarms were later compared to assess performance. c Cartoon showing stimulus type and optogenetic stimulation. Mice were trained to report 20 Hz, 1.5 or 3 mN vibrotactile stimuli. Mice that reached a performance level of d’ > 1.5 had their forepaw exposed to yellow light the next day (565 nm, 30’) with the same protocol used in skin-nerve recordings. Immediately after the light exposure, their sensitivity to the same vibrotactile amplitude was again tested. d Mean hit and false alarm rates across trials for Sox10-ArchT mice, reporting vibrotactile stimuli on the session before inhibition (left) and after the inhibition (right) (n = 5). e Comparison of mean sensitivity index (d’) across trials from same data shown in (d) (n = 5). f Lick raster plot from an example mouse during vibrotactile detection task, before (top) and after (bottom) the optogenetic inhibition. First lick in each trial is shown in black, other licks in gray or yellow. g Session average hit and false alarm rates of Sox10-ArchT mice on different behavior sessions. Statistically significant differences between hits and false alarms were found on the sessions before optogenetic stimulation (before), after optogenetic stimulation (recovery) and after optogenetic stimulation of the tested (after, P = 0.0028, n = 5) and contralateral paw (opposite paw control) (P < 0.001, Two-way ANOVA with Bonferroni post-hoc, n = 5). h Session average sensitivity (d’) values of Sox-10-ArchT mice when reporting the vibrotactile stimulus. The sensitivity was lower after the optogenetic inhibition (P = 0.0058) than on the session before. Moreover, the sensitivity was also lower after inhibition of the vibrotactile-sensing paw than after inhibition of the opposite, non-stimulated paw (P = 0.007, two-way ANOVA with Bonferroni post-hoc) (n = 5). Data are presented as mean values ± s.e.m. Box plots show: median at center, upper and lower quartiles at the bounds of box, whiskers are at minima and maxima. Source data are provided as a Source Data file.

