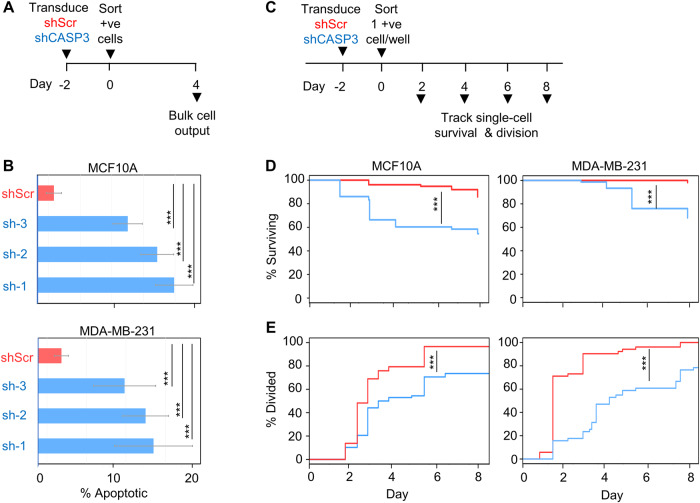
Fig. 3. ShCASP3 induces rapid cell death.
A Experimental plan for tracking the loss of viability in shCASP3- and shScr-transduced cells in bulk cultures. B Flow cytometrically determined proportions of Annexin V+ and/or PI + MCF10A and MDA-MB-231 cells assessed 3 days after FACS isolation of CASP3 shRNAs or shScr transduced cells. Values shown are the mean ± SEM of data from 3 separate experiments, each using CASP3 shRNA#1 and the same shScr shRNA (***P < 0.001, Student’s t-test). C Experimental plan for assessing the proliferation and death of single cells in culture. D Kaplan–Meier (KM) survival plots showing rapidly induced death in individually tracked shCASP3-transduced cells. Data are from 72 wells each initially containing a single shCASP3-transduced cell and 72 wells similarly initiated with a single shScr-transduced cell. Results have been compared using a log-rank test (***P < 0.001). E Cumulative plots of the timing of the first division (≥2 cells/well) of shCASP3- and shScr-transduced cells plated in (D) and compared using the Komoglerov–Smirnov test (***P < 0.001).

