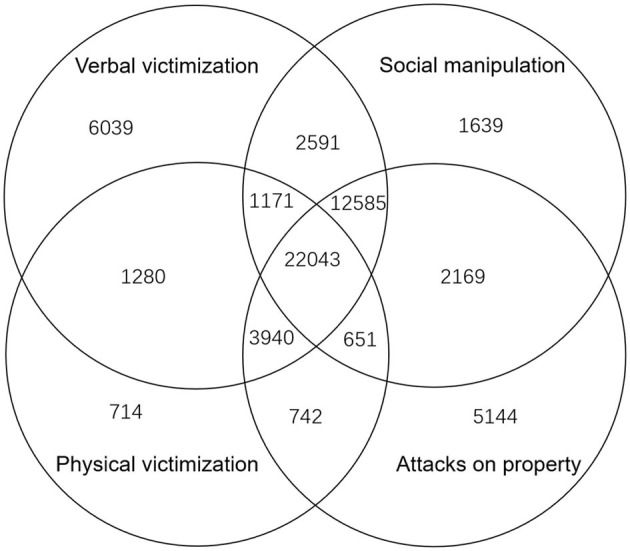
Figure 1.

A Venn diagram of types of school bullying. The Venn diagram illustrates the number of students who have experienced different types of school bullying. Each block is marked by the number of students in the corresponding set. For example, 1,171 represents the number of students who have experienced verbal victimization, physical victimization, and social manipulation, but not attacks on property. Two data points are not shown in the diagram: 7,455 students who experienced both verbal victimization and attacks on property and 179 students who experienced both physical victimization and social manipulation.
