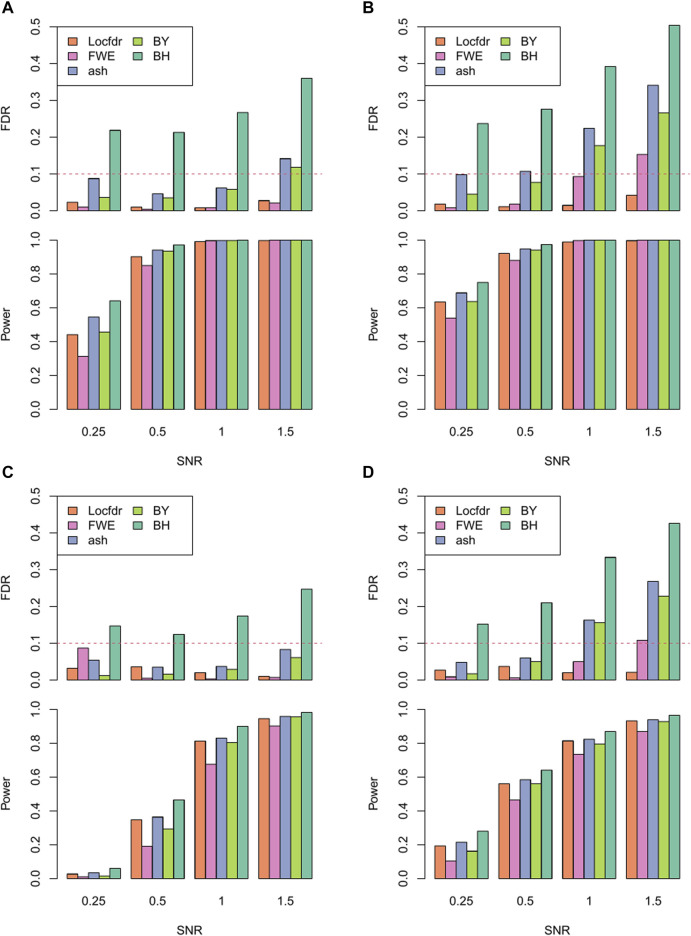
FIGURE 3.
Power and FDR of different multiple comparison correction methods across different SNR levels under the combination of resolution and domain heterogeneity: (A). High resolution in homogeneous domain. (B). High resolution in heterogeneous domain. (C). Low resolution in homogeneous domain. (D). Low resolution in heterogeneous domain.

