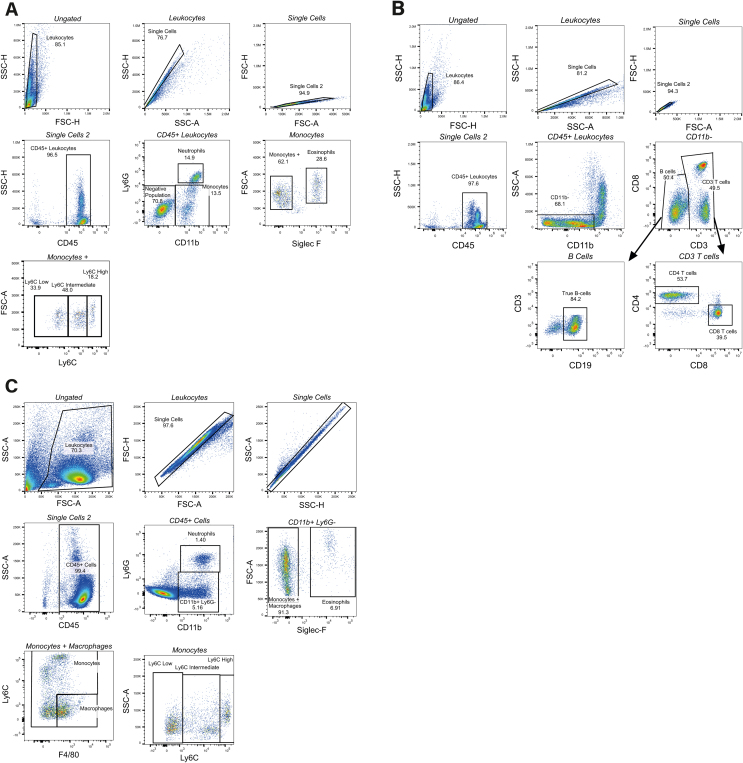
Supplemental Fig. 3.
Gating strategies for in vivo blood and spleen flow cytometry analysis. A) Example gating strategies for myeloid and B) lymphoid cell subsets during blood collections at week 0, 5 and 8 of HFD. C) Example flow cytometry gating for dissociated spleen samples on day of sacrifice. All plots are read from left to right and top to bottom unless highlighted by a black arrow. Italic plot titles highlight which gate is being displayed from the previous plot.

