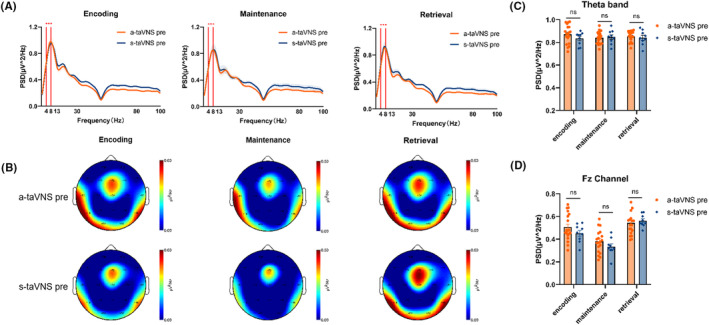
FIGURE 3.

Patterns of neural oscillation during each WM phase in the pre‐taVNS state. (A) Average PSD curve as a function of frequency during WM‐encoding, maintenance, and retrieval phases. The theta‐frequency band was prominent during each phase. (B) Spatial distribution of theta oscillations during each WM phase. Power is indicated by color. Theta PSD was concentrated in the frontal region, and the Fz channel was prominent. (C and D) Comparison of theta PSD in the whole brain (C) and Fz channel (D) between the a‐taVNS and s‐taVNS groups during each WM phase. There was no significant difference between the two groups in any WM phase before taVNS treatment. ns, non‐significant.
