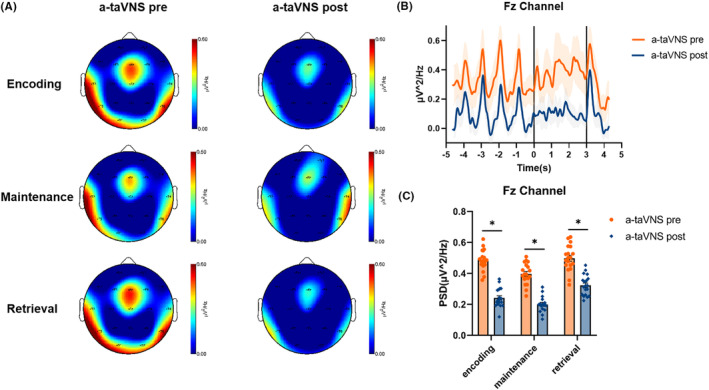
FIGURE 4.

Characteristic theta oscillation patterns in the a‐taVNS group during each WM phase. (A) Spectral distribution of theta power in the pre‐taVNS state and the post‐taVNS state during the encoding, maintenance, and retrieval phases of WM. (B) Representative plot of average theta PSD in Fz channel during the WM task. The x‐axis shows the time course of the task; the left, central, and right areas separated by the solid black lines represent the encoding, maintenance, and retrieval phases of WM, respectively. The y‐axis shows the average theta PSD in the Fz channel. (C) Comparison of theta PSDs in the Fz channel between the pre‐ and post‐taVNS states during each WM phase. The theta PSD was reduced in the post‐taVNS state compared with the pre‐taVNS state. *p < 0.05.
