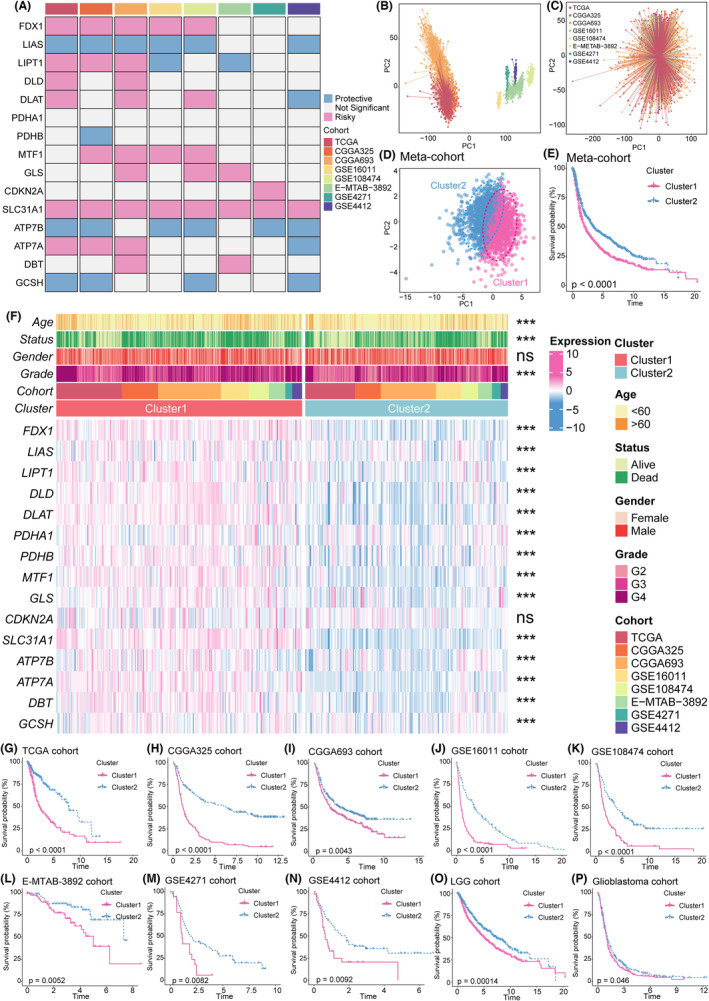
FIGURE 1.

Identification of two cuproptosis subgroups by unsupervised clustering based on k‐means. (A) This heatmap demonstrates the prognostic value of cuproptosis‐related genes in eight cohorts. (B, C) PCA shows expression baseline before (B) and after (C) removing the batch effect of eight cohorts. (D) PCA for the transcriptome profiles of cuproptosis patterns in the meta‐cohort. (E) The log‐rank test and Kaplan–Meier curves revealed significant survival rate differences between the two cuproptosis clusters in the meta‐cohort. (F) This heatmap demonstrates the relationships between the two cuproptosis phenotypes, clinicopathologic characteristics, and the expression variations in the cuproptosis‐related genes. The top portion represented Fisher's precise test. The lower portion indicated the Wilcoxon rank‐sum test. ***p < 0.001, **p < 0.01, *p < 0.05, and “ns” stands for no statistical significance. (G‐P) The log‐rank test and Kaplan–Meier curves revealed significant survival rate differences between the two cuproptosis clusters in the TCGA (G), CGGA325 (H), CGGA693 (I), GSE16011 (J), GSE108474 (K), E‐MTAB‐3892 (L), GSE4271 (M), GSE4412 (N), LGG cohort (O), and glioblastoma cohort (P).
