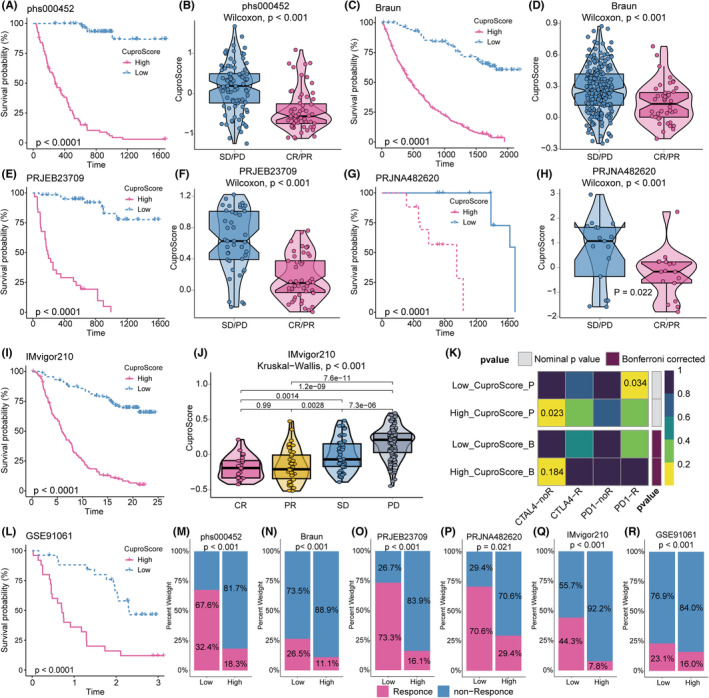
FIGURE 6.

CuproScore Predicts the Response of Gliomas to Immunotherapy. (A) The Kaplan–Meier curve showed a significant difference in survival rate between the high and low CuproScore groups in the phs000452 cohort. (B) The Wilcoxon rank‐sum test of CuproScore variation in anti‐PD‐L1 responsiveness in the phs000452 cohort. (C) The Kaplan–Meier curve showed a significant difference in survival rate between the high and low CuproScore groups in the Braun cohort. (D) The Wilcoxon rank‐sum test of CuproScore variation in anti‐PD‐L1 responsiveness in the Braun cohort. (E) The Kaplan–Meier curve showed a significant difference in survival rate between the high and low CuproScore groups in the PRJEB23709 cohort. (F) The Wilcoxon rank‐sum test of CuproScore variation in anti‐PD‐L1 responsiveness in the PRJEB23709 cohort. (G) The Kaplan–Meier curve showed a significant difference in survival rate between the high and low CuproScore groups in the PRJNA482620 cohort. (H) The Wilcoxon rank‐sum test of CuproScore variation in anti‐PD‐L1 responsiveness in the PRJNA482620 cohort. (I) The Kaplan–Meier curve showed a significant difference in survival rate between the high and low CuproScore groups in the IMvigor210 cohort. (J) The Kruskal–Wallis test of CuproScore variation in anti‐PD‐L1 responsiveness in the IMvigor210 cohort. (K) The submap algorithm predicts the probability of anti‐PD1 and anti‐CTLA4 immunotherapy response in high and low CuproScore groups. (L) The Kaplan–Meier curve showed a significant difference in survival rate between the high and low CuproScore groups in the GSE91061 cohort. (M‐R) The stacked histogram shows the difference in immunotherapy responsiveness between the high and low CuproScore groups in phs000452 (M), Braun (N), PRJEB23709 (O), PRJNA482620 (P), IMvigor210 (Q), and GSE91061 (R).
