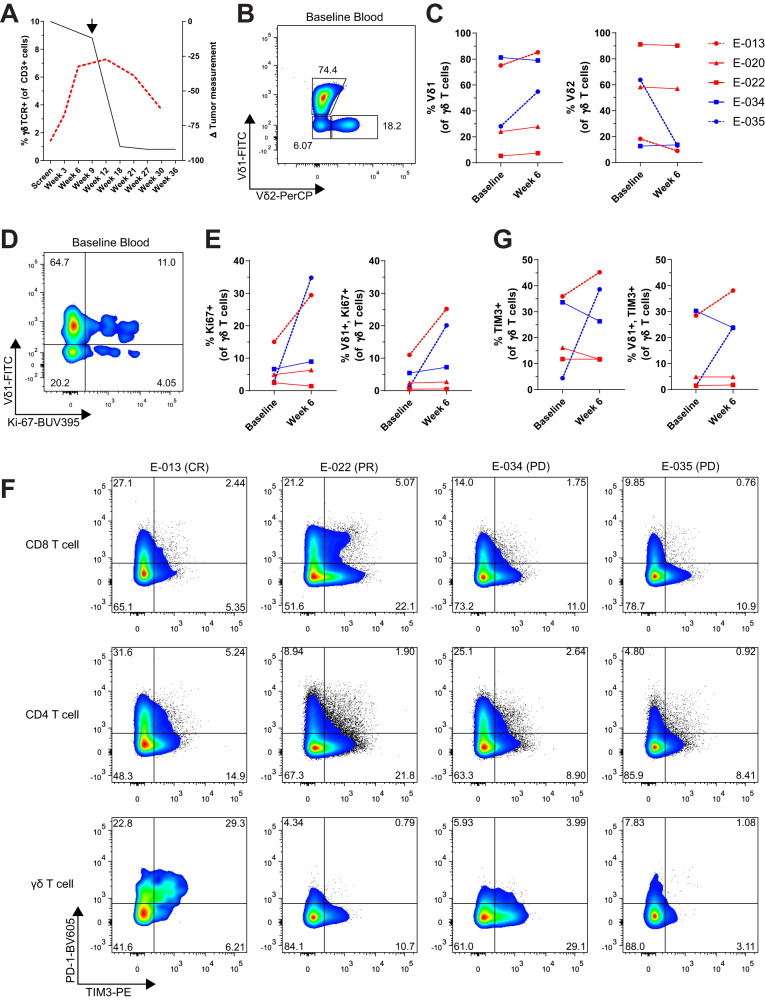
Fig. 2. Vδ1 T cells were activated and proliferate in peripheral blood after anti-PD-1 treatment in a complete responder MCC patient.
A Expansion of γδ T cells measured by flow cytometry is compared with tumor regression over time. The red dotted line represents γδ T cell frequency measured in peripheral blood from patient E-013. Tumor measurements from E-013 by CT scan are indicated by the black line. Arrow denotes when the on-treatment tumor biopsy was taken. B Flow cytometry analysis of Vδ1 and Vδ2 subsets gated on γδ T cells from patient E-013 baseline blood. C Frequency of Vδ1 cells (left) and Vδ2 cells (right) in peripheral blood at baseline and week 6 from five MCC patients as shown in the legend. D Proliferation gated on γδ T cells from baseline blood of E-013 was evaluated by flow cytometry. E Summary of Ki-67+ γδ T cells (left) and Ki-67+ Vδ1 cells (right) for five of the MCC patients as shown in the legend of (C). F Flow cytometry plots of PD-1 and TIM-3 expression gated on CD8, CD4 and γδ T cells from baseline blood of four MCC patients. G Summary of TIM-3+ γδ T cells and TIM-3+ Vδ1 cells in blood of five MCC patients. Source data for (C, E and G) provided as a source data file.

