

Abstract
Cells cultured on stiff 2D substrates exert high intracellular force, resulting in mechanical deformation of their nuclei. This nuclear deformation (ND) plays a crucial role in the transport of Yes Associated Protein (YAP) from the cytoplasm to the nucleus. However, cells in vivo are in soft 3D environment with potentially much lower intracellular forces. Whether and how cells may deform their nuclei in 3D for YAP localization remains unclear. Here, by culturing human colon cancer associated fibroblasts (CAFs) on 2D, 2.5D, and 3D substrates, we differentiated the effects of stiffness, force, and ND on YAP localization. We found that nuclear translocation of YAP depends on the degree of ND irrespective of dimensionality, stiffness and total force. ND induced by the perinuclear force, not the total force, and nuclear membrane curvature correlate strongly with YAP activation. Immunostained slices of human tumors further supported the association between ND and YAP nuclear localization, suggesting ND as a potential biomarker for YAP activation in tumors. Additionally, we conducted quantitative analysis of the force dynamics of CAFs on 2D substrates to construct a stochastic model of YAP kinetics. This model revealed that the probability of YAP nuclear translocation, as well as the residence time in the nucleus follow a power law. This study provides valuable insights into the regulatory mechanisms governing YAP dynamics and highlights the significance of threshold activation in YAP localization.
Keywords: Cancer Associated Fibroblast (CAF), Yes Associated Protein (YAP), cell force dynamics, matrix stiffness, nuclear deformation
Graphical Abstract

1. Introduction
Cell traction force is a critical element of mechanotransduction that drives many physiological and pathological processes [1,2]. In the context of cancer, cell force influences the crosstalk between cancer and stromal cells (e.g. fibroblasts and immune cells) [3,4]. The microenvironment in most solid tumors hosts an abundance of cancer associated fibroblasts (CAFs) that are highly contractile and mechanosensitive [5–7]. CAFs are also responsible for stiffening the stroma and establishing a dynamic crosstalk with the cancer cells to drive metastatic progression [2]. However, the mechanism by which CAFs control this process is not well-understood, especially in a mechanically dynamic microenvironment. Recent studies indicate that CAFs utilize Yes Associated Protein (YAP) as a primary mechanosensor to probe the physical environment and regulate intra-/extra-cellular signaling that facilitates metastasis [8–10]. Hence, activation of YAP in CAFs is an extremely important process in cancer progression. Previous results indicate that stiffness and cellular contractility control YAP activation on 2D substrates. Majority of these studies report static assessments, although cellular force (and YAP) are dynamic. To our knowledge, there is no literature on the role of contractility fluctuations in regulating the time-dependent response of YAP in CAFs. Since YAP activation process is dynamic, it is necessary to identify the nature of such dynamics in order to understand cellular behavior in response to nuclear localization of YAP. To address this gap, we measured CAF (primary human colorectal CAF05 cells) traction dynamics on substrates with different stiffness and extra-cellular matrices (ECM); and investigated the kinetics of YAP activation in response to dynamic contraction and relaxation by the CAFs.
YAP is a transcription co-activator that shuttles between the cytosol and the nucleus [10]. When localized in the nuclei, YAP binds with TEA domain family members (TEAD) and regulates several pro-oncogenic pathways [8,11]. For example, activation of YAP facilitates aberrant cell proliferation, growth of solid tumors, chemoresistance and metastasis [12–15]. YAP is also involved in modulating crosstalk between cancer cells and CAFs [16]. In solid tumors, YAP is known to shuttle to the nuclei in most cencer cells during advanced stages [10], when the tumors become mechanically stiffer than the normal tissue. Dupont and colleagues [9] found that YAP is regulated by substrate stiffness and cell spreading, independent of the Hippo pathway in MCF10A mammary epithelial cells (MECs). Wada et al. [17] reported that cytoskeletal stress-fibers (F-actin) promote nuclear YAP by regulating the Hippo pathway in mouse normal fibroblasts [18]. Later, Elosegui-Artola and colleagues [19] provided evidence that cell force triggers nuclear deformation which controls the transport of YAP across the nuclear membrane. These studies provided significant insights into the YAP activation mechanism. However, most of these experiments were performed with either epithelial cells or normal fibroblasts on 2D substrates which do not represent a 3D tumor microenvironment (TME).
Recent studies with cells in 3D matrices present confounding results on YAP activation [20]. For example, in 3D collagen-Matrigel scaffolds, MECs (MCF10A, normal epithelial) showed increased YAP activation with higher stiffness [21]. In contrast, nuclear localization of YAP in the same MECs did not correlate with elastic moduli of basement membrane-derived 3D matrices [22]. Calvo and colleagues [23], showed that nuclear YAP in CAFs increases with increasing stiffness of collagen. However, cellular force and ECM mechanical properties constantly change with time, and how the rate of change impacts YAP is poorly understood. Therefore, this study explores the following unresolved questions: what biophysical cues promote YAP nuclear translocation? Is it substrate stiffness, cell contractile force, or nuclear deformation? Is there any role of force rate in regulating the transport? Is the cue different for 2D and 3D, or is there a common universal cue that the cells employ, independent of dimensionality (2D, 3D)? We hypothesize that nuclear deformation is a universal driving mechanism, across different physical environments, by which YAP is activated in CAFs. We tested the hypothesis by assessing the role of matrix stiffness, cell force, and contractility-induced nuclear deformation in 2D, 2.5D (see Methods), and 3D environments on YAP kinetics.
We found that activation of YAP in CAFs is influenced by nuclear deformation induced by a fraction of total cell forces, rather than the total force and substrate stiffness. Our analysis demonstrated that perinuclear force-induced nuclear deformation exhibits the strongest correlation with YAP activation across various experimental conditions. We also observed YAP nuclear localization in stretched nuclei of CAFs in human colon and prostate tumors, indicating the potential role of nuclear strain in YAP translocation in vivo. Finally, we utilized the relationship between perinuclear and total force to develop a mathematical model that accurately predicts the time-dependent nucleo-cytoplasmic transport of YAP in response to cellular force variations. Our findings presented here provide significant insights into the dynamics of YAP activation in CAFs and offer valuable tools for predicting dynamic activation of YAP under different conditions.
2. Materials and Methods
2.1. Cell culture
Human primary colorectal cancer associated fibroblasts, CAF05 (Neuromics, Edina, MN, USA) were maintained in Vitroplus III, Low Serum, Complete medium (Neuromics, Edina, MN, USA). Commercially available culture media was supplemented with 1% Penicillin-Streptomycin (Lonza).
2.2. Substrate preparation
For 2D and 2.5D substrates, polyacrylamide (PA) hydrogels were prepared with fluorescent particles embedded and localized near the top surface (detailed method in [24]). We used 200 nm dark red beads (excitation/emission-660/680 nm, Thermo-Fisher, cat. no. F8807) and maintained a bead density of approximately 1 per 5 μm2 on the gel surface. Hydrogel elastic moduli of 0.5, 10 and 40 kPa were achieved by controlling Acrylamide (Sigma-Aldrich) and Bis-acrylamide (Sigma-Aldrich) concentrations as reported by Tse and Engler [25]. Polymerization was initiated with 10% Ammonium persulfate (APS, Bio-Rad) and 1% Tetramethyl-ethylenediamine (TEMED, Bio-Rad) and the gels had approximately 110 μm depth after polymerization between two glass coverslips [24].
After polymerization, substrates were functionalized with fibronectin (Human, Corning) and collagen I (Rat-tail, Corning), following the protocol described by Tse and Engler [25]. Briefly, 0.2 mg/ml sufosuccinimidyl-6-(4’-azido-2’-nitrophenylamino)-hexanoate (Sulfo-SANPAH, Thermo Scientific) solution in HEPES buffer (50 mM HEPES at pH 8.5, Fisher Scientific) was applied to the PA gels and then was activated with 365 nm UV light (8 Watt, UVP UVL-28, Analytik Jena, US). After washing with phosphate buffered saline (PBS), the substrates were then immersed overnight in 25 μg/ml fibronectin (in HEPES buffer) or collagen (in PBS) solution. The gels were then washed with PBS, CAFs were plated on the substrates and imaging started after 3–4 hrs.
For 2.5D cultures, CAFs were allowed to grow on 2D PA gel substrates for 6–8 hrs. At this point, we prepared 2 mg/ml collagen I solution with pH 7.2; from a high concentration stock solution of 8.9 mg/ml (Corning), following Corning recommended protocol [26]. Next, media from the 2D culture was aspirated, and collagen solution was added to cover the cells on PA gel substrates. The thickness of the collagen layer was ~500 um. Collagen was allowed to polymerize for 15–20 mins and then culture media was added to the dish and imaging was resumed.
2.3. Traction force microscopy (TFM)
For measurement of cell force (both 2D and 2.5D cases), TFM were performed on CAFs adherent to PA gel substrates embedded with fiducial beads (Fig. 1A–B). Fluorescent images of the beads were taken every 5 mins for the whole duration of the experiment. Cells were then removed using Sodium Dodecyl Sulfate (SDS) and bead images were taken as references. The intensity of the excitation light was maintained below the safe threshold as specified in our previous study [27]. These images were compared and analyzed for deformations and strain generated by the cells. Traction stress/force was quantified using the following equations: max. traction stress , and total traction force , where is local traction stress on area dA. Analysis of TFM images was performed using ImageJ open-source software.
Fig. 1:
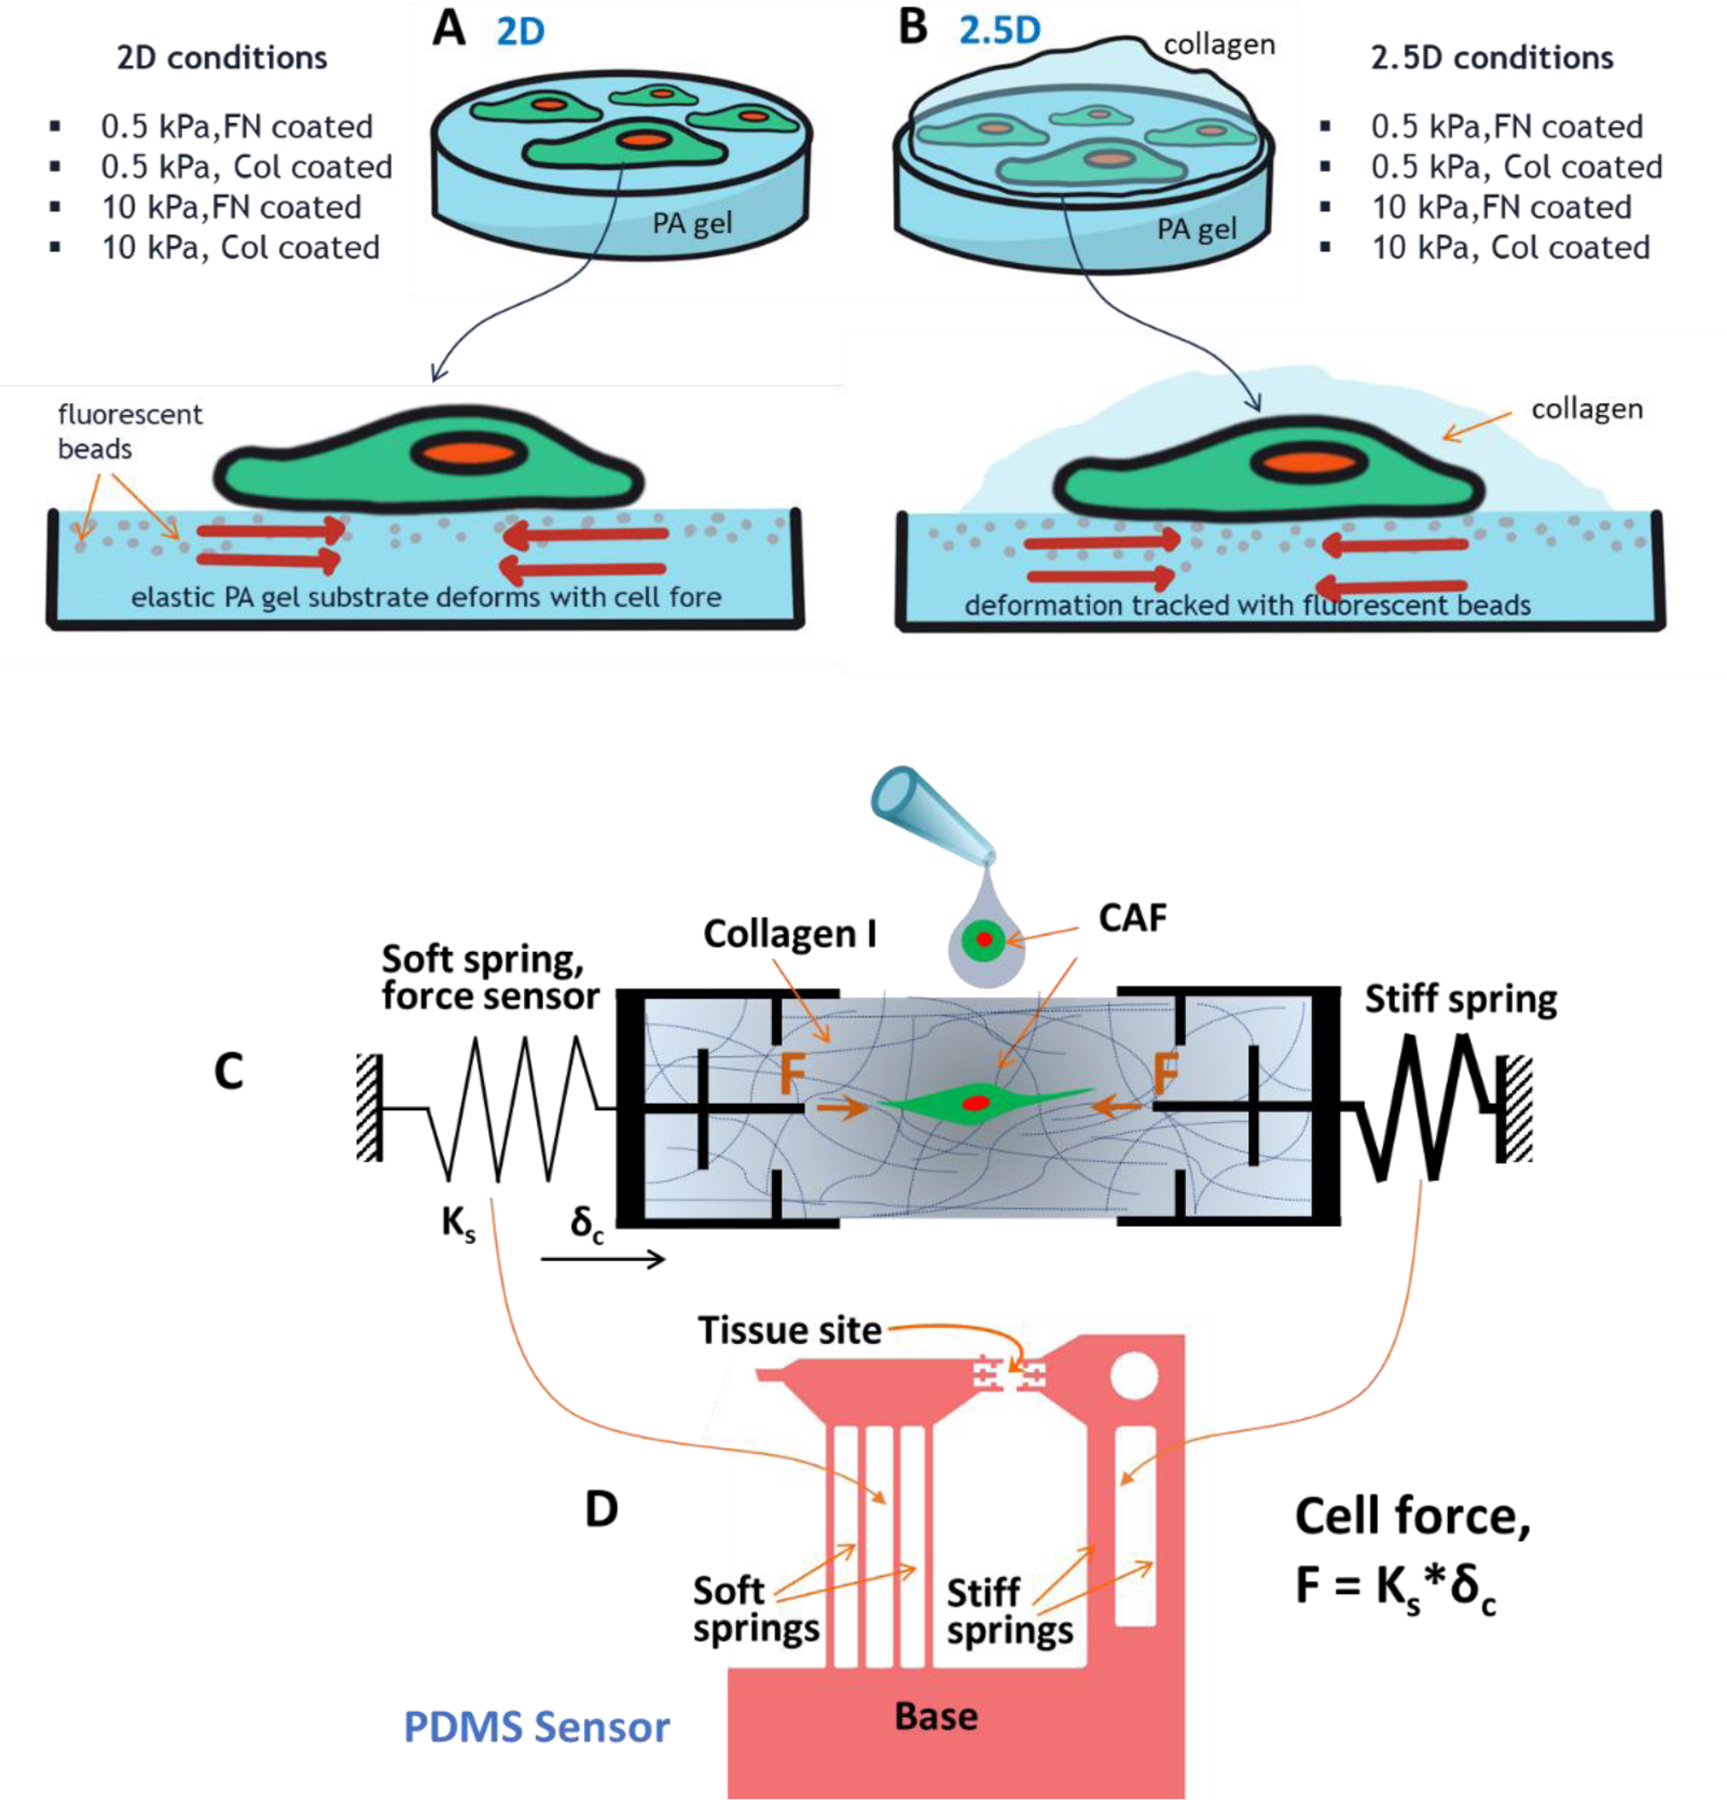
Cell contractility measurement techniques for various culture conditions. Cell forces were measured with traction force microscopy on (A) 2D and (B) 2.5D systems on PA gel substrates coated with specified ECM. 2.5D refers to the culture where 2D adherent cells are covered with fibrous collagen matrix on top. PA gels with different elastic modulus (0.5 and 10 kPa) were functionalized with either fibronectin (FN) or collagen (Col). A number of combinations were studied to characterize the 2D and 2.5D systems. (C) Schematic diagram of a sensor that measures cell forces in 3D matrices. The sensor is comprised of a soft spring, a stiff spring and two grips connected to the springs. To measure single cell force in collagen, a capillary bridge is formed with cell-collagen precursor solution between the grips. After polymerization, the CAF pulls on collagen by force , and the soft spring deforms by . Hence, cell force is measured as , where is the stiffness of the force sensing soft spring. (D) Design of the sensor made with PDMS. Details of the biomechanical sensor is available in [28,29].
Rates of force increase or decrease were measured from consecutive data points collected every 5 mins. For determining residence time in contraction, we measured the length of time when the force rate is continuously positive. Similarly, residence time in relaxation was measured as the duration of time when the force rate is continuously negative. When there is a change from contraction to relaxation (or, relaxation to contraction) in consecutive points, we assumed a linear transition to determine the time when the force rate is zero.
2.4. Force measurement in 3D collagen
Single-cell force in 3D collagen scaffolds were measured using a biomechanical sensor (Fig. 1C) we previously developed [28]. A detailed experimental procedure is outlined in our publicly available protocol [29]. This technique allowed us to measure single cell force, a significant improvement to other methods that measures force from multicellular (~hundreds of cells) tissues [30,31]. Briefly, the sensor has a force-sensing spring connected to a self-assembled micro-tissue with a single cell embedded in a 3D collagen matrix. As the cell becomes contractile, the force gets transmitted to the spring and deforms it. If the cell generates force , the soft spring deforms by a distance of , where and are the initial and contracted lengths of the tissue. Using brightfield images, was measured from analysis with ImageJ software and the force on the spring was determined as . Total cell force was measured as twice the force on the spring, assuming that the cells were polarized and generating a force dipole.
2.5. Mechanical characterization of collagen scaffolds
Shear rheology was done on an ARES-G2 rotational rheometer (TA Instruments, DE) using an 8 mm parallel-plate geometry with gaps ranging from approximately 800–1,200 microns. To ensure attachment of collagen to the loading plates, polydimethylsiloxane (PDMS, Sylgard 184, Dow) disks approximately 1 mm in thickness were functionalized with 3-Aminopropyl-triethoxysilane (APTES, Sigma-Aldrich) and 0.5% glutaraldehyde (Electron Microscopy Sciences) and then attached to the top and bottom plates. The compliance of the PDMS disks () is negligible compared to the collagen samples (maximum ). The collagen samples (Rat-tail collagen I, Corning) were gelled in situ on the rheometer. Collagen precursor solutions are made and kept on ice until the test time. Approximately 55 μL of the collagen precursor solutions was deposited on the bottom plate and the upper plate was then lowered into position. A thin layer of heavy mineral oil (FCC/USP, Fisher Chemical) was applied to the sample free surface to prevent evaporation. The temperature was then raised to 37°C to start the gelation.
Small-amplitude oscillatory shear at 10% strain amplitude and frequency of 1 rad/s was applied to monitor the gelation for 1 hour (Fig. S1) Gelation results in an initially rapid increase of viscoelastic moduli which approach a more stable condition after about 1 hour, as quantified by the evolving mutation timescale, (SI). Gelled samples are then subjected to the two intended rheological experiments (i.e., frequency sweep and then the strain amplitude sweep). The linear viscoelasticity was assessed using frequency sweep experiment. The test was performed at strain amplitude of , sweeping the frequency down from 100 to 0.01 rad/s (Fig. S2). The strain-amplitude sweep experiment was done at 1 rad/s, sweeping up from 1% (Fig. S3). The test results show that the linear-nonlinear transitioning strain amplitude for all three concentrations is about 100%. This finding confirms linear viscoelasticity in Fig. S3 from . The linear viscoelastic shear moduli at 1 rad/s of all three concentrations are , 91.1 and 187 Pa for 1mg/ml, 2mg/ml and 3mg/ml respectively. Therefore, assuming a nominal Poisson’s ratio of 0.495, the tensile (Young’s) elastic moduli for 1mg/ml, 2mg/ml and 3mg/ml collagen are approximately ~200, 270 and 560 Pa respectively.
To mimic tumor stiffness (on the order of ~10 kPa [32]) in 3D collagen, we needed to increase the elastic modulus of collagen scaffolds. To achieve this, we uniaxially stretched the collagen specimens constructed on the sensor (with and without cells) and utilized strain-stiffening of collagen (Fig. S4). Following polymerization, the collagen specimens were subjected to uniaxial tensile loading within the first 30 minutes. A tensile strain of 20–30% was generally adequate to achieve ~10-fold increase in stiffness. The samples remained under tension for a period of 24 hours. During this period, the samples underwent stress relaxation and creep that further enhanced the stiffness. Next, a second phase of tensile loading was applied to measure the current stiffness. Finally, the specimens were fixed with 4% Paraformaldehyde (PFA, Electron Microscopy Sciences) for immunostaining.
2.6. Immunostaining and YAP transfection
For confocal imaging, cells were fixed with 4% PFA in PBS for 30 mins. 0.2% Triton X-100 in PBS was used to permeabilize the samples and 2.5% bovine serum albumin (BSA) with 2% normal goat serum (NGS) in PBS was used as a blocking solution. Samples were then incubated overnight in YAP1 primary antibody (1:500) (Invitrogen, cat. no. PA1–46189). Next, the samples were incubated with Alexa Fluor 568 conjugated secondary antibody (1:1000) (Abcam Inc., cat. no. ab175695) and Phalloidin conjugated with Alexa Fluor 647 (1:40) (Invitrogen, cat. no. A-22287) at 4°C for 12 hrs. Afterwards, the samples were washed with PBS, then incubated in 4′,6-diamidino-2-phenylindole (DAPI) (1:1000) (Invitrogen, cat. no. D1306) for 10 minutes and washed with PBS again. Samples were imaged with a confocal microscope, LSM710 (Zeiss), using an EC Plan-Neofluar 20X/0.5 NA objective lens (Zeiss).
Human tumor tissues were collected from US Biomax as flash-frozen paraffin-embedded slices on microscope slides. The tissue slices were deparaffinized, rehydrated and treated for antigen retrieval with citrate buffer. Afterwards, the samples were stained for αSMA (1:500) (Sigma, cat. no. A5228), YAP and DAPI as described in the previous paragraph.
CAFs were transfected with pEGFP-C3-hYAP1 (a gift from Marius Sudol, Addgene plasmid # 17843) for live tracking of YAP and FRAP experiments [33].
2.7. Fluorescent Recovery After Photobleaching (FRAP)
We carried out FRAP experiments with LSM880 (Zeiss) confocal microscope equipped with a cell culture chamber that maintains temperature, CO2 and humidity. C-Apochromat 40x/1.2W (Zeiss) objective was used for image acquisition. Before the FRAP experiment, the nuclei of the live cells were stained with Hoechst 33342 (Thermo Scientific, cat. no. 62249) for 15 mins. Next, we identified the whole nuclei as the region of interest and performed photo-bleaching at the mid-plane of the nuclei. A 488 nm Argon laser was used at 75% power with ~1 μs exposure per pixel for 30 repetitions. During recovery of the fluorescent signal, images were taken approx. every second. The intensity of pre-specified regions of high and low curvature (see Fig. 5G, Movie 6) inside the nuclear envelope was calculated in ZEN software (Zeiss). Normalized recovery curves were fitted to the following exponential model to determine time constants for different regions of interest.
where is normalized YAP intensity, is normalized plateau intensity and is the time constant.
Fig. 5:

Actin cap and traction force within the perinuclear region correlate well with YAP activation in 2D and 2.5D. Actin (red) and DAPI (blue) at the apical plane of the nuclei in CAFs on (A) 2D and (B) 2.5D. Arrows in the insets show some actin fibers over the nuclei. (C) Relative comparison of actin cap intensity between 2D and 2.5D. (D) Representative substrate displacement field from cell traction on 10 and 40 kPa. Green lines define cell boundaries, blue ellipses are the nuclei and yellow dotted lines show the hypothetical perinuclear region with ~50 um diameter. Plots show total cumulative force within perinuclear regions. (E-F) Nuclear deformation, perinuclear force and nuc/cyt YAP demonstrate strong correlation. (G) Regions of interest (ROI) for FRAP experiments to determine steady-state influx rate through nuclear membrane. (H) Mean fluorescence recovery curves for high (HC) and low curvature (LC) ROIs reveal that influx of YAP from the cytosol to the nucleus is higher in HC compared to LC. Column chart shows time constants determined by fitting traditional exponential functions used for FRAP. Box: median, 25th and 75th percentile; whiskers: standard deviation; blue dot: mean. Columns: mean ± SD. Data collected from n≥5 cells for ~10 hrs. Statistical significance were determined by one-way ANOVA with Tukey’s mean comparison (F-G). *** p<0.001; ** p<0.01 and * p<0.05. Displacement color scales in microns. Scale bars: 50 um.
2.8. Simulation
The simulations for this study were performed using a custom Python script on Google Colab, a cloud-based platform for running Jupyter notebooks. We applied the Gillespie algorithm to simulate the stochastic time evolution of single-cell force that regulates nuclear deformation and subcellular localization of the YAP transcription factor. For each cell, the total time duration for the simulation was 48 hours, with time steps of 5 minutes (same as the experimental force readout intervals). Next, we performed a Monte-Carlo simulation (n=100) to calculate the persistence time and probability of activated YAP (above threshold nuc/cyt ratios). Relevant equations, constants and parameter categorizations are presented in Table 1 and Table S1
Table 1:
Parameters and constants of simulation.
| Equations | Constants | Source(s) |
|---|---|---|
| max. substrate velocity, | [34–38] | |
| focal adhesion diameter, | [39–42] | |
| substrate Poisson’s ratio, | ||
| stall force, | [3,43–45] | |
| stiffness const., | ||
| shape & scale factors: , (Table S2, Fig. S6) | expt. fit | |
| shape & scale factors: , (Table S3, Fig. S6) | expt. fit | |
|
, if E=0.5 kPa
.82, if E=10 kPa .42, if E=40 kPa |
expt. data | |
| strain for height, strain for diameter, nuc. def., |
elastic modulus, | [46,47] |
| viscous time const, | ||
| Poisson’s ratio, | ||
|
|
[19,48] expt. fit | |
For quantification of force dynamics, we assumed that the temporal resolution of 5 min is sufficient and force change within 5 min intervals is linear. Mean residence times in contraction and relaxation for all cases were longer than 5 mins, validating this assumption. For the stochastic model of cell force dynamics, the steps were approximated from the Weibull distribution fitted to the experimental force rates. It was also assumed that each step is independent of force history, and force at any time cannot be negative. Statistical comparison of experimental and simulated force rates indicates that the model successfully predicts cell force dynamics. While the simulation considered non-linear relationship between cell force and nuclear deformation, mechanical properties of the nucleus were assumed from previously reported values in the literature. Finally, we assumed a linear relationship between ND and YAP import rate, based on results published by Elosegui-Artola et al[19].
2.9. Statistical analysis
Correlation coefficients between various parameters were determined using both linear (Pearson) and non-linear (Spearman, Kendall) methods. Force rates were fitted to Normal and Weibull Distribution functions. Statistical significance was determined by one-way ANOVA with Tukey’s mean comparison (*** p<0.001; ** p<0.01 and * p<0.05). All statistical analyses were performed with Origin (2022) software.
3. Results
CAFs exhibit higher spreading area and contractility with increasing substrate stiffness on 2D substrates. With increased contractility, the nucleus undergoes higher deformation. Therefore, the effects of contractility and nuclear deformation (ND) could not be assessed independently with cells on 2D substrates. To overcome this coupling between cell force and ND on 2D substrate, we utilized a hybrid system where cells were cultured on 2D polyacrylamide (PA) hydrogels functionalized with ECM (e.g. fibronectin and collagen), and then collagen scaffolds were added on top of the cells (Fig. 1B). This method allows the cells to perceive mechanical cues from the 2D substrate as well as 3D fibrous collagen (referred to as 2.5D henceforth) [49]. We observed that nuclear deformation is low in 2.5D, regardless of substrate stiffness, cell spreading, or force. Cell spreading in 2.5D is higher compared to that on 2D; as opposed to force that is lower in 2.5D. This allowed us to utilize 2.5D as a tool to differentiate the effects of stiffness, force, and nuclear deformation on YAP.
Cellular forces on 2D and 2.5D were measured as a function of time (time lapse) using TFM (Fig. 1A–B) [50,51]. We utilized PA gels coated with fibronectin and collagen for 2D TFM. Elastic moduli of the hydrogels were 0.5 and 10 kPa. For 3D culture, we used rat tail collagen I with a concentration of 2 mg/ml and measured cell force with a high-resolution sensor (see Methods) [28,29]. Cell force dynamics allowed us to formulate a model that predicts the dynamics of nuclear accumulation of YAP. It should be noted that PA gel and collagen may present different cues to the cells. PA gels were utilized for their suitability with TFM and tunability of stiffness (particularly higher stiffness that are not attainable with collagen). For 3D hydrogels, collagen was utilized to mimic the native ECM for CAFs in the TME. To ensure ECM compatibility across different systems, PA gels (for 2D and 2.5D) were coated with collagen. The following sections describe the key findings from the study-
3.1. Cell force decreases from 2D to 3D
To understand how dimensionality affects cell contractility, we compared cell traction in 2D, 2.5D and 3D. We cultured CAFs on 0.5 kPa PA gel substrate (for 2D case, Movie 1,2), covering the cells plated on 0.5 kPa substrate with 0.5 kPa collagen (2.5D case, Movie 3,4), and in 0.5 kPa collagen gel (3D case). Side-by-side phase contrast timelapse for all three cases is presented in Movie 5. PA gel substrates were functionalized with collagen I to match the ECM. We found that cell force in 3D collagen was nearly half the force on 2D (Fig. 2). Force in 2.5D was also significantly lower than that on 2D, for both fibronectin and collagen coating on PA substrates.
Fig. 2:

Total cell forces measured on different culture systems reveal the effects of stiffness, ECM and dimensionality. (A) Comparison of total CAF force on 2D, 2.5D and 3D. To ensure consistency of ECM and stiffness, data with collagen coated 0.5 kPa are plotted. Cell forces for different (B) 2D and (C) 2.5D systems. Here, 2D_10kPa_FN refers to fibronectin coated PA gel substrate with 10 kPa elastic modulus. 2.5D_0.5kPa_Col means collagen coated 0.5 kPa PA gel with fibrous collagen scaffolds over the cells for 2.5D. Data collected from n≥ 5 cells for ~10 hrs. Box: median, 25th and 75th percentile; whiskers: standard deviation; blue dot: mean. Statistical significance was determined by one-way ANOVA with Tukey’s mean comparison. *** p<0.001; ** p<0.01 and * p<0.05.
We repeated the above experiments with a higher substrate stiffness (10 kPa). As expected, increased substrate stiffness resulted in higher cell forces for both 2D and 2.5D cases (Fig. 2B–C). Interestingly, CAFs generated slightly lower force on collagen-coated substrates than on fibronectin-coated substrates (Fig. 2B–C). We also observed a significant decrease in cell contractility when the CAFs transitioned from 2D to 2.5D, i.e., when cells cultured on 2D substrate was covered by collagen blanket. It appears that interaction with collagen above the substrate prompts the CAFs to reduce their traction on the 2D substrate below. How much force is “lost” in the collagen matrix in 2.5D cases remains unaccounted, since TFM only captures the force on the PA gel substrate. Thus, the force quantified for 2.5D cultures is a lower bound of the total cell force.
3.2. In 2.5D and 3D systems, stiffness may not regulate YAP signaling in CAFs
To explore how cell traction, in association with stiffness and dimensionality, affects YAP signaling, we investigated the subcellular localization in CAFs in different microenvironments. We find that in 2D, nuclear YAP increases with increasing substrate stiffness (0.5, 10 and 40 kPa), consistent with the literature (Fig. 3A) (quantification in Fig. 4) [20]. Surprisingly, 2.5D systems do not exhibit such a trend. Irrespective of substrate stiffness, localization of YAP within the CAFs is very similar for all 2.5D cases (Fig. 3B). For 3D collagen matrices, we utilized 1 mg/ml (E = ~200 Pa), 3 mg/ml (E = ~560 Pa) and strain-stiffened 3 mg/ml (E = 20 kPa, ) (Fig. S3, S4, S5). We found that nuclear YAP slightly increased in 3 mg/ml collagen compared to that in 1 mg/ml (Fig. 3C). Note that even the high-density collagen (3 mg/ml) is softer than most colorectal tumors that have elastic moduli of ~ 5–15 kPa [32]. Hence, strain-stiffened 3 mg/ml collagen mimics the stiffness of the TME and triggers a significant increase in nuclear YAP in CAFs (Fig. 3C). However, the stiffness-YAP relationship in 3D collagen is not similar to that on 2D, indicating influence of other factors in YAP activation. We shall explore possible mechanisms in the following sections.
Fig. 3:

Immunocytochemistry of CAFs reveal subcellular YAP localization in different (A) 2D, (B) 2.5D and (C) 3D systems. For 2D and 2.5D systems, 0.5, 10 and 40 kPa elastic moduli were studied. For 3D collagen, 1 mg/ml (E= 200 Pa), 3 mg/ml (E= 560 Pa) and strain-stiffened 3 mg/ml (E= 20kPa, ) were used for investigating effects of stiffness. Scale bars: 50 um.
Fig. 4:

YAP activation in CAFs exhibit varying correlation with mechanical and phenotypic characteristics e.g. substrate stiffness, cell spreading area, contractility and nuclear deformation (ND). (A) Cell spreading area and (B) force for CAFs on different 2D and 2.5D substrates. (C-H) Nuc/cyt YAP and ND on 2D, 2.5D and 3D conditions with varying stiffness. 0.5, 10 and 40 kPa stiffness were used for 2D and 2.5D cases; 1 mg/ml (0.2 kPa), 3 mg/ml (0.6 kPa) and strain-stiffened 3 mg/ml (E= 20kPa, ) collagen were used for 3D. Nuc/cyt YAP is the ratio of mean fluorescence intensity within the nucleus to that of the cytosol. ND is defined as the ratio of largest principal axis to the smallest. (I-K) Contour plots show correlation strength between nuc/cyt YAP and relevant parameters. (L) ND exhibits the strongest correlation with nuc/cyt YAP. Correlation coefficients are in Table S4. Data points are from individual cells on 2D, 2.5D and 3D. Box: median, 25th and 75th percentile; whiskers: standard deviation; blue dot: mean. Columns: mean ± SD. Data collected from n≥ 5 cells for ~10 hrs. Statistical significance were determined by one-way ANOVA with Tukey’s mean comparison (F-G). *** p<0.001; ** p<0.01 and * p<0.05.
3.3. Nuclear deformation by perinuclear cell force correlates with YAP activation
Cell spreading area and traction force are two important regulators of cell functions. Hence, we checked if these parameters correlate with YAP activation levels (measured as intensity ratio of nuclear to cytosolic or, nuc/cyt YAP) for different systems. Fig. 4A shows that cell spreading area increases with substrate stiffness in 2D and 2.5D, although 2.5D system stimulates the cells to spread more, especially on lower stiffness substrate. However, cells generate a lower force in 2.5D compared to that on 2D with the same stiffness (Fig. 4B). Typically, cell spreading and force are coupled (controlled by stiffness [3]) and they exhibit a positive correlation with YAP on 2D (Fig. 4A,B,C). In contrast, in 2.5D system, neither of these parameters correlate with YAP activation (Fig. 4A,B,E). For example, cell spreading area increased with substrate stiffness increasing from .5 kPa to 10 kPa (Fig. 4A), yet nuc/cyt YAP remained the same (Fig. 4E). Again, contractility increases with increasing stiffness (Fig. 4B), although YAP localization remained unchanged (Fig. 4E). In 3D, nuclear YAP increases with increasing stiffness of collagen (1 mg/ml, 3 mg/ml and stiffened 3mg/ml with E = 200 Pa, 560 Pa and 20 kPa respectively) (Fig. 4G). These conflicting results suggest that YAP nuclear shuttling may depend on other factors downstream of cell traction force.
For normal fibroblasts on 2D substrates, force induced nuclear deformation (ND), defined by the ratio of largest to smallest dimensions of the nuclei, strongly correlates with YAP activation [19]. Hence, we measured nuclear deformation for CAFs in 2D, 2.5D and 3D (Fig. 4D,F,H) to assess any correlation with matrix stiffness, cell area, force and YAP activation (Fig. 4I–L). From the contour plots, it is apparent that stiffness (Fig. 4I) and cell spreading (Fig. 4J) have poor relationships with ND and YAP. Cell force has a relatively better correlation, as shown in Fig. 4K. Overall, only ND demonstrates a strong correlation with nuc/cyt YAP for all conditions (Fig. 4L, Table S4), indicating that ND is a possible regulator of YAP nuclear localization in 2D, 2.5D and 3D.
Interestingly, nuclear deformation remained the same in all 2.5D cases, although cell force increased with increasing stiffness (Fig. 4B,F). This force (measured on 2.5D) is a fraction of the total cell force and thus serves as a lower bound. This implies that cell contractility is unable to cause enough ND in 2.5D. To resolve this paradox, we examined the actin caps over the nuclei of the CAFs. The perinuclear actin cap is defined as a thick layer of acto-myosin filaments anchored to the apical surface of the nucleus [52]. Previous studies [53,54] suggest that actin caps are responsible for compressing and deforming the nuclei of cells on 2D substrates. We found that actin caps over nuclei of cells on 2D are well developed and uniform, compared to those in 2.5D where the actin caps are not uniform (Fig. 5A–B). We also measured the average fluorescence intensity from actin on the apical surface of the nuclei. Fig. 5C shows that actin cap intensity on 2D is stronger compared to that on 2.5D. Hence, we hypothesized that cell nuclei on stiffer 2D substrates are under more compression from the actin cap and thus have higher deformation compared to that in 2.5D.
ND is usually caused by the cytoskeletal forces on the actin cap. Therefore, we anticipated that nuclear area and YAP would correlate with cell traction force. Contradictorily, on 40 kPa 2.5D substrates, nuc/cyt YAP is low, although the total force is higher than 10 kPa 2D condition where nuc/cyt YAP is higher (Fig. 4B,C,E). We hypothesized that a fraction of the total cell force contributes to ND, not the entirety. Moreover, recent findings by Shiu et al. [53] indicate that cell traction force from the perinuclear region (~25 um radius) controls flattening on the nucleus. To test our hypothesis, we measured the perinuclear traction force from a circular region defined by 25 um radius from the center of the nucleus (Fig. 5D). Interestingly, the perinuclear force shows excellent correlation with both ND and nuc/cyt YAP (Fig. 5E–F, Table S4), implying perinuclear force induced nuclear deformation influences nuclear localization of YAP. This suggests that total cell force is an incomplete descriptor of nuclear deformation or YAP translocation. It is the part of the force contributing to nuclear deformation and hence YAP localization.
3.4. Membrane curvature criteria significantly correlate with YAP nuclear localization in vitro and in vivo
Transmembrane transport is a complex process, and it is not clear whether and how nuclear deformation facilitates YAP transport across nuclear membranes, especially in 3D matrices. In 2D and 2.5D cultures, the projected nuclear area on the substrate plane provides an approximation of nuclear deformation. However, in 3D, such a parameter is inadequate, mainly due to the orientation of the nucleus with respect to the line of sight. Elosegui-Artola et al. [19] proposed that stretching of nuclear membrane pores as a result of flattening increases the import rate into the nuclei. We hypothesize that nuclear flattening results in change of envelope curvature that affects the influx and efflux of YAP to and from the nucleus. We tested this hypothesis with CAFs on stiff 2D substrates. CAFs were transfected with EGFP-YAP, prior to performing fluorescent recovery after photobleaching (FRAP) experiments. EGFP-YAP inside the nucleus was photo-bleached, and recovery was measured at two locations – i) low curvature (κ ~ 0, mid region) and ii) high curvature (κ ~ 1/h, near periphery) regions, where h is the height of the nucleus near the periphery (Fig. 5G). As expected, we found that recovery at high curvature locations was faster compared to that near low curvature (Fig. 5H, S7, Movie 6). These results indicate that the influx of YAP through the flat regions of the nuclear envelope (e.g. top and bottom) is slower, compared to import through curved surfaces. However, further exploration is necessary to verify this mechanism.
3.5. Cytoskeletal re-organization leads to lower nuclear deformation and YAP in 2.5D and 3D
On 2D, CAFs have a well-developed actin cap that is anchored mostly in the perinuclear region and thus compresses the nucleus (Fig. 6A, S8). Away from the perinuclear region, acto-myosin contractility does not contribute to nuclear deformation, although it adds to the total force measured by TFM. In contrast, on 2.5D, cells form focal adhesions on the apical cell surfaces and thus actin fiber orientation (with an under-developed perinuclear cap) does not contribute to nuclear deformation (Fig. 6B, S9). Hence, increasing cellular force with substrate stiffness fails to localize YAP in the nucleus. In contrast, in 3D collagen, cell contractility deforms the nucleus more efficiently. Here, cells become highly polarized, and most of the contractile force contributes to deforming the nuclei. In addition, ND is increased by the compression of the collagen matrices as the cells migrate through its pores (Fig. 6C). For this reason, CAFs in 3D can localize YAP in the nuclei with much lower contractile force, and in much softer microenvironment in contrast to that in 2D or 2.5D.
Fig. 6:

Three-dimensional cytoskeletal organization of CAFS in (A) 2D and (B) 2.5D and (C) 3D. Maximum intensity projections from confocal immuno-fluorescence images provide structures of actin, nucleus (DAPI), focal adhesions (vinculin) and YAP on the XY plane. Collagen structures for 2.5D and 3D cases are visualized with second harmonic generation (SHG) images. Sectional views shows that the z-profiles are different for different cases. Blue arrows indicate strong actin caps for cells on 2D, white arrows indicate weakly developed actin caps in 2.5D, and red arrow indicates focal adhesions with collagen in 2.5D. Cartoons illustrate the distinct features of actin, focal adhesions and nuclei on 2D, 2.5D and 3D matrices.
3.6. Nuclear YAP correlates with nuclear deformation in vivo
The tumor microenvironment (TME) is significantly more complex compared to that of our simplified monoculture models in vitro. In addition to heterogeneous physical conditions in the TME, CAFs and other cells are constantly engaged in chemical and mechanical crosstalk. Therefore, it is not obvious if nuclear deformation will produce YAP activation in vivo similar to that we observed in vitro. Consequently, we wanted to check if high ND and envelope curvatures correlate with increased nuclear YAP in vivo. We collected and stained human prostate (Fig. 7A) and colon (Fig. 7B) cancer tissues for αSMA, YAP and nuclei to find if there is a correlation between ND and nuc/cyt YAP in the TME. αSMA is highly localized in the stroma and helps distinguish between epithelial and stromal regions. Investigating the tissues, we found that the nuclei in the stroma are more deformed compared to the nuclei in the epithelium. We also found evidence that highly deformed and stretched nuclei have higher YAP in both prostate and colon tumors. These findings corroborate the hypothesis that high membrane curvature possibly enhances nuclear YAP in tumor cells. This raises the possibility of using ND as a prognostic marker of YAP activation in vivo.
Fig. 7:

Immunohistochemistry of human (A) prostate and (B) colon cancer tissues reveal highly deformed nuclei are more likely to have increased nuclear YAP. αSMA, YAP and DAPI is stained in red, green and blue respectively. White arrows locate nuclei that have relatively small deformation and red arrows indicate nuclei that are highly deformed.
3.7. Cell force dynamics in 3D is slower compared to that in 2D
Now that we have a relationship between (perinuclear) cell force, nuclear deformation and nuclear YAP, we sought to determine the dynamics of contractility and relaxation, that will be utilized to develop a predictive model for YAP activation kinetics. To this end, we performed timelapse TFM for 2D and 2.5D cultures to investigate the dynamics of cell traction force. For cells in 3D collagen, we used a biophysical sensor [28] to measure contractility with time. Cell force was measured every 5 minutes for ~24 hours. Fig 7A shows that CAFs require a long time (~15–20 hrs) to reach the maximum force in 3D collagen matrices. During this process, cell contractility exhibits large fluctuations. On 2D and 2.5D, cells reach a steady force within 4–6 hrs of plating. Force fluctuations in these cases are smaller compared to the maximum force (Fig. 8B). As the cells transition from 2D to 2.5D, contractility is reduced to a lower steady state (Fig. 8B) Also, cells exhibit a slower contractility rate in 3D compared to that in 2D and 2.5D. To quantify force dynamics, we first evaluated force rates (time derivative of force) at different time points (shown as orange curves in Fig. 8A–B). A positive rate implies that the cell is actively contracting, while a negative rate indicates that the cell is relaxing its force. The duration of time when a cell is continuously contracting, or relaxing is referred to as residence time.
Fig. 8:

Temporal variations in active contraction and relaxation periods reveal differences in CAFs’ behavior in 2D, 2.5D and 3D. (A) Blue curve shows cell force with time, orange curve shows corresponding time rate of force. (B) Blue and green curve show single cell force as it transitions from 2D to 2.5D. Orange and yellow curves are corresponding force rates in 2D and 2.5D respectively. If the force rate in A-B positive, the cell is actively increasing force; negative force rate means that the cell is reducing its contractility. (C-E) Residence time in contraction (CRT) and relaxation (RRT) is defined as the duration of time when the cell is continuously increasing or decreasing force. Green and red shades on A-B show examples of CRT and RRT respectively. Box: median, 25th and 75th percentile; whiskers: standard deviation; black dots: distribution of data points. (F-G) Comparison of CRT and RRT for cells in 3D, 2.5D and 2D systems with collagen coating and 0.5 kPa elastic modulus. In 3D collagen, cells have longer residence time during both cases. Columns show mean and SD. Data collected from n≥ 5 cells for ~10 hrs. Statistical significances were determined by student’s t-test (C-E) and one-way ANOVA with Tukey’s mean comparison (F-G). *** p<0.001; ** p<0.01 and * p<0.05.
We quantified the residence times during 5–14 hrs for 2D culture and 6–22 hrs for 2.5D and 3D. We found that the residence time in contraction (CRT) is significantly longer than the relaxation residence time (RRT) in 3D and 2.5D (Fig. 8C–D). On 2D substrates, however, the difference between CRT and RRT is not significant (Fig. 8E). This suggests that in 3D, average cell force was increasing with time during our observation, and it takes much longer time for cells to reach a steady state compared to that on 2D, where cells spend the same duration of time for increasing and decreasing force. In 2.5D, cells exhibit a transitory behavior. With the addition of collagen on cells in 2D (beginning of 2.5D), cell traction on 2D substrate decreases with time. Cells possibly shift part of the force to collagen ECM above the 2D substrate. Lastly, residence times (i.e. CRT and RRT) become longer from 2D to 3D, indicating slowing dynamics (Fig. 8F–G).
Next, we compared the force rates for different substrate stiffness (Fig. 9). Similar to the total force, contraction and relaxation rates are higher with increased stiffness (Fig. 9A–D). Moreover, force rates (both contraction and relaxation) on soft 0.5 kPa substrates are dependent on the ECM. With both 2D and 2.5D systems, we observed lower rates for collagen coating, compared to fibronectin coating. Also, cells in 3D exhibit considerably slower rates compared to cells in 2D and 2.5D (Fig. 9E–F). This implies that changes in ND and nuclear YAP over time in 3D should also be slow, compared to that in 2D.
Fig. 9:

Comparison between force rates for CAFs in different experimental systems. Contraction and relaxation rates on (A-B) 2D and (C-D) 2.5D systems. Box: median, 25th and 75th percentile; whiskers: standard deviation; black dots: distribution of data points. (E-F) Comparison of contraction and relaxation rates for cells in 3D, 2.5D and 2D systems with collagen coating and 0.5 kPa elastic modulus. Charts show mean ± SEM. Data collected from n≥ 5 cells for ~10 hrs. Statistical significance were determined by student’s t-test (C-E) and one-way ANOVA with Tukey’s mean comparison (F-G). *** p<0.001; ** p<0.01 and * p<0.05.
3.8. A mathematical model simulating force-induced YAP transport reveals the dynamics of sub-cellular YAP localization
YAP activation or nuclear localization is a dynamic process. It is clear from our studies and others [19,53] that intracellular force, or a fraction thereof, may deform the nucleus of cells on 3D and 2D cultures respectively, and that ND mediates nuclear localization of YAP, although the mechanism by which ND facilitates YAP localization remains unclear. Inside the nucleus, YAP pairs with DNA-binding factors of the TEAD family to regulate gene expressions for various cell functions [55]. The time constant for YAP localization due to ND, i.e., the time it takes for YAP to enter the nucleus due to an applied nuclear deformation, has been determined experimentally and is found to be on the order of a minute (Fig. 5H). In contrast, cells take more than an hour to significantly change its force state. Hence it is reasonable to assume that YAP activation dynamics follows cell force dynamics. The frequency of YAP nuclear localization above a threshold concentration, and its residence time provides insight on the probable cell functions mediated by YAP localization. Here, we develop a simple stochastic model to estimate YAP dynamics, and the probability of YAP nuclear localization above a given threshold, and its residence time. The model simulates the dynamics of cell traction force and nuclear deformation in order to predict the time-dependent fluctuations in YAP nuclear localization. We developed the biomechanical model based on our experimental data that provides a comprehensive description of cell force dynamics on various substrates, and the correlation between force-induced nuclear deformation and YAP localization. Using the model, we investigated how stiffness-dependent contractility dynamics regulate nuclear deformation and YAP kinetics. Next, we performed a Monte-Carlo simulation to gather deeper insights into the effects of stiffness on persistence times of nuclear YAP above different threshold nuc/cyt ratios.
The model considers a cell that generates force by deforming the substrate/matrix from a zero-force state (eq. 1–5). Cell force contributes to the deformation of the nucleus and nuclear localization of YAP (Fig. 10A). The model assumes that the cell contracts to attain a steady state dependent on the matrix stiffness. The steady state force is determined from the experimental measurements corresponding to various stiffness. This constitutes the deterministic component of the total cell force (eq. 3–4). To account for the short-term random force fluctuations as observed in experiments, we added a stochastic component to model total cell force. Such fluctuations in contractility may result from various cellular activities e.g. polarization, migration, and division. The step sizes of is determined from experimental force histogram (eq. 5). Total cell force dynamics is described by the following set of equations-
| (1) |
| (2) |
| (3) |
| (4) |
| (5) |
Fig. 10:

Simulation results of YAP dynamics provide statistical insights into the persistence and probability of active YAP. (A) 1D model for cell force generation and nuclear deformation mechanism. Cellular acto-myosin generated forces (both deterministic and stochastic) are simulated from experimental results. A fraction of the total force drives nuclear deformation. Nuclear deformation regulates YAP influx to the nucleus and thus controls dynamics of nuc/cyt YAP. (B) Time evolution of representative simulations of force and YAP for substrates with elastic modulus of 0.5, 10 and 40 kPa. Mean (C) force and (D) nuc/cyt YAP from Monte-Carlo simulations. Comparison between experimental data and simulation results for (E) force vs stiffness [45,57–59] and (F) nuclear deformation vs nuc/cyt YAP relationships shows that the model accurately predicts the mean outputs. Mean persistence times (G) above and (H) below thresholds exhibit a power-law relationship with nuc/cyt YAP ratios. (I) Probabilities of active YAP with respect to different thresholds mostly show linear relationship for all three stiffness. (J-M) Simulation results of YAP dynamics of CAFs in 3D collagen. (J) Time evolution of representative single cell simulations of force and YAP for substrates with elastic modulus of 0.5 and 0.8 kPa 3D collagen. Mean (K) force and (L) nuc/cyt YAP from Monte-Carlo simulations. (M) Probabilities of active YAP with respect to different nuc/cyt ratio.
Here, is the deterministic component of force rate that represents acto-myosin generated force which tends to stabilize at (mean steady force on a substrate with stiffness ). is the substrate deformation velocity due to , is the maximum single-cell force, and is the characteristic substrate stiffness. To establish a relationship between cell force F and substrate deformation, we assumed a linear relation , given that substrate deformation by the cell force is small. Hence, rate of change in force is proportional to substrate deformation rate (or, deformation velocity).We simplified Hill’s [34–36] force-velocity relationship for muscles to obtain the following-, where indicates energy per unit deformation (thus have unit of force), is a constant of rate of energy dissipation (unit of velocity), and is assumed to be a constant. This was utilized for calculation of force rate in eq. 3. Typically, cells increase their force with increasing stiffness until force reaches a plateau [45]. Hence, we assumed a saturating exponential that matches experimental results (eq. 4) to determine relationship between steady force and stiffness . is the stochastic force rate based on the empirical distribution data presented in Fig. 9. , , and , are fitting shape and scale parameter pairs respectively of Weibull Probability Distribution Functions (PDF) for experimental contraction and relaxation rates (Table S2–3).
A fraction of the total force that is responsible for nuclear deformation is referred to as perinuclear force (Fig. 10A). Here, is specific to culture conditions (e.g. stiffness and dimension), and is determined from experimental results in Fig. 4–5. The remainder of the force, not linked to the nucleus, is termed cytosolic force . Nucleus is a viscoelastic material [46,56], hence we simulated nuclear deformation according to viscoelastic Kelvin-Voigt model (eq. 6).
| (6) |
Here, is the nuclear deformation; and are nuclear elasticity and viscosity, respectively. Next, kinetics of nuc/cyt YAP is defined by a model for nucleo-cytoplasmic transport of transcription factors by Peercy and Schneider [48]. For a given stiffness, Nuc/cyt YAP ratio as a function of time, , is governed by a first-order ordinary differential equation (eq. 7)-
| (7) |
[48], where and are effective efflux and effective influx rate constants. For a simplified model, we assumed that influx rate varies linearly with nuclear deformation (i.e. ) [19].[19] This assumption is based on experimental results that show increased YAP influx rate with increasing cell force and ND [19]. The same study reported that YAP efflux rate remained unchanged with increased force or ND, hence we assumed to be a constant.
Simulation results for sample cells indicate that both force and YAP fluctuate considerably with time (Fig. 10B), instead of reaching a steady state. Hence, cells may switch between active and inactive states, even on substrates with high stiffness. To gather insights into the stochastic process, we performed a Monte-Carlo simulation (n=100) to investigate the relationship between YAP activation thresholds, persistence time (duration of continuous active state), and probability of active/inactive states for different substrate stiffness. The mean force and nuc/cyt YAP, for different stiffness, agree with our experimental results and literature (Fig. 10C–F, [45,57–59]). Next, we performed a YAP threshold sweep and determined the relationship with persistence times above (PTAT) and below (PTBT) thresholds (Fig. 10G–H). The threshold nuc/cyt YAP was varied between 1 to 2.6, as these ratios are relevant in cancer and may activate different sets of downstream genes in an intensity and/or persistence-dependent manner. Remarkably, we found that both PTAT and PTBT maintain a power law relationship (Probability of persistence time ) with the threshold level, . We determined the values of the exponent, , to be ~ −2.7 and ~2.8 for PTAT and PTBT, respectively. Interestingly, this slope is stiffness-invariant, meaning that the curves shift up or down with increasing or decreasing substrate stiffness. Hence, these relationships can perhaps be inter- or extra-polated for other stiffnesses that do not have experimental data. Finally, we measured the fraction of total time that nuc/cyt YAP remains above the thresholds (i.e. active state) that indicates the probability of YAP activation for a certain threshold. As expected, for all stiffnesses, the probability of active YAP decreases with increasing thresholds (Fig. 10I). With increasing substrate stiffness, these curves shift towards the right, indicating that higher stiffness enhances the probability of higher nuc/cyt YAP (Fig. 10I).
YAP dynamics model for CAFs in 3D collagen
The mathematical framework for modeling YAP dynamics in CAFs on 2D can be extended for 3D cases with some minor adjustments. First, the scale and shape factors (, , and , ) were determined by fitting Weibull Probability Distribution Functions (PDF) for contraction and relaxation rates for CAFs in 3D. Next, we changed the loading configuration to determine nuclear deformation. For 2D cases, we assumed compressive loading that is applied by the actin cap to flatten the nucleus. For 3D cases, we assumed tensile loading that elongates the nucleus to determine nuclear deformation . The rest of the model was kept unchanged. Fig. 10J–M shows force and YAP dynamics simulated by the model. These results provide critical insights into the dynamics of YAP activation that can be extremely useful in clinical applications targeting YAP-dependent signaling.
4. Discussion
YAP is a transcription activator that plays critical roles in various diseases, development, and homeostasis [10,55,60,61]. Its regulation involves both biochemical and mechanical cues. Biochemically, YAP is controlled by the Hippo signaling pathway [8]. Mechanically, YAP responds to cues such as ECM rigidity, cytoskeletal tension, spreading area and strain [9,18,19,21,23]. However, the specific contributions of these elements and the mechanisms by which mechanical signals regulate YAP are still unclear. This paper explores the role of biophysical cues for nuclear localization of YAP in colorectal CAFs.
We found that cell traction depends on ECM and dimensionality. Cell contractility and the rate of contraction/relaxation on 2D are higher than those in 2.5D; although the spreading area is smaller (on 2D compared to that in 2.5D). We hypothesize that stress relaxation in collagen is likely to be responsible for such response from the cells. Polyacrylamide gels are linear elastic; hence cells can form and mature more focal adhesions that help generate higher force on 2D.
However, in 3D viscoelastic collagen, formation of mature focal adhesions is reduced due to viscous relaxation of stress. As a result, cell force in 3D collagen is lower than that in 2D. Also, to compensate for low forces in collagen, cells tend to spread more in 2.5D compared to 2D.
We also found that irrespective of stiffness, cell force or spreading, ND and nuclear YAP in 2.5D is very low. This finding suggests a contradiction to the assertions made by Fischer et al. [49], where it was proposed that 2.5D substrates mimic stiffness-controlled 3D matrices. Development of focal adhesions and traction with apical collagen scaffolds in 2.5D leads to re-distribution of cytoskeletal force away from the nucleus, reducing nuclear deformation. In 3D, the cells become polarized, and the actin stress fibers form a bundle around the nuclei. As a result, the entire cell force might be involved in nuclear deformation. Cartoon models of the cytoskeletal configuration (Fig. 6A–C) illustrate the re-distribution in different microenvironments that present distinct physical cues.
On 2D, our results agree with studies [9,17,62,63] that found substrate stiffness, total force, cell spreading area and F-actin stress fibers to correlate with nuclear YAP. In 3D, however, such correlation is not evident in many cases [20,22]. Our results with different 3D matrices (e.g. collagen and Col-Tgel [64]) corroborate these findings. We found that high stiffness in collagen (achieved by applying strain on the matrix) induced nuclear accumulation of YAP (Fig. 3C). On the other hand, there was no significant difference in YAP nuclear localization in Col-Tgel with 0.5 and 10 kPa elastic modulus (Fig. S10). It should be noted that both collagen and Col-Tgel present similar adhesion motifs (RGD sequence) to the cells. This raises the question whether there is a common mechanism of YAP activation across all dimensionalities. Indeed, our results reveal that nuclear deformation triggers YAP activation in both 2D and 3D conditions. In Col-Tgel matrices, both soft and stiff, ND was low which resulted in low nuc/cyt YAP ratios. In contrast, strain-stiffened collagen matrices allowed cell elongation and higher ND leading to YAP nuclear translocation aided by high influx rates through regions of high membrane curvature. These results establish that nuclear deformation is a strong mechanotransduction checkpoint for YAP activation in CAFs. Our in vivo data is limited to CAFs in primary human colon and prostate cancers. However, solid tumors with increased stiffness where CAFs are abundant, typically have similarities in cancer progression. In addition, our strain-stiffened collagen matrices mimic the tumor stiffness (~10 kPa), as well as fiber alignment observed in most solid tumors [32,65–70]. Hence, we believe that the results are relevant for breast and pancreatic cancer as well [71].
Finally, we investigated how cell force dynamics regulate nuclear deformation and YAP kinetics to control subcellular localization of the transcription factor. It is crucial to have a clear understanding of the dynamics in order to predict the accurate effects of nuclear localization of YAP. The time it takes for YAP activation to translate to downstream signaling can vary depending on a number of factors, including the cell type, the specific signaling pathway involved, and the nature of the downstream effectors [72]. Earlier studies have suggested that YAP activation can lead to downstream signaling within minutes to hours of activation. For example, YAP regulation in liver cells led to the modulation of genes involved in differentiation, extracellular matrix synthesis and fibrogenesis within 30 mins to 24 hrs of YAP (in-)activation [73,74]. Some other downstream effects of YAP activation may take longer to manifest [73]. Another study with epithelial ovarian canscer cells found that YAP activation stimulated long-term (16 hr) cell migration through downstream activation of amphiregulin (AREG) and epidermal growth factor receptor (EGFR) [75]. In addition, a different set of genes may require a different level (threshold) of nuclear YAP to induce the intended effects. Therefore, persistence times of YAP above certain thresholds may play important roles in determining the downstream effects of YAP signaling. Short-term YAP activation (lower persistence times) may lead to transient changes in gene expression and downstream signaling, while long-term YAP activation (higher persistence times) may lead to more sustained changes and potentially deleterious effects. To our knowledge, there is no information in the literature about the persistence times of YAP activities.
We developed a mathematical model to predict the time-dependent nucleo-cytoplasmic YAP transport in response to cellular force variations. While studies on YAP dynamics are scarce, recent experimental results [76–78] on YAP dynamics qualitatively agree with our in silico predictions of YAP fluctuations. Monte Carlo simulations of YAP dynamics showed that YAP in CAFs can switch between active and inactive states, and the persistence time of active YAP shows a power law dependence with respect to the activation thresholds. This means that the probability of YAP being localized in nucleus decreases as the activation threshold increases (Fig. 10I). These results can potentially be interpolated for a wide range of physiological stiffness and thus become extremely useful in clinical prognosis, where the tumor stiffness and YAP-threshold can predict the probability of metastasis or relapse. However, further research is necessary to establish the relationship between YAP thresholds and downstream metastatic outcomes.
Overall, the study provides biophysical insights into the mechanisms of YAP activation, its persistence and probability. The results can be useful in clinical applications targeting YAP-dependent signaling, as understanding the precise kinetics of YAP activation and downstream signaling may have important therapeutic implications. The study highlights the importance of considering the temporal dynamics of YAP signaling and its implications for cellular behavior and disease. Understanding the precise kinetics of YAP activation and downstream signaling may also have important therapeutic implications, as targeting YAP has emerged as a promising strategy for the treatment of various cancers and other diseases where aberrant YAP activity is observed [79,80].
Supplementary Material
Statement of Significance.
Yes Associated Protein (YAP), a transcription cofactor, has been identified as one of the drivers of cancer progression. High tumor stiffness is attributed to driving YAP to the nucleus, wherein it activates pro-metastatic genes. Here we show, using cancer associated fibroblasts, that YAP translocation to the nucleus depends on the degree of nuclear deformation, irrespective of stiffness. We also identified that perinuclear force induced membrane curvature correlates strongly with YAP nuclear transport. A novel stochastic model of YAP kinetics unveiled a power law relationship between the activation threshold and persistence time of YAP in the nucleus. Overall, this study provides novel insights into the regulatory mechanisms governing YAP dynamics and the probability of activation that is of immense clinical significance.
Acknowledgments
The authors thank Dr. Duncan Nall and You Jin Song for assistance with the plasmids, Carl R. Woese Institute for Genomic Biology for confocal imaging and FRAP experiments, and MechSE MNMS for microfabrication of the sensors. Research reported in this publication was partially supported by the National Institute of Biomedical Imaging and Bioengineering of the National Institutes of Health under Award Number T32EB019944 and Beckman Institute Graduate Fellowship to BE. The content is solely the responsibility of the authors and does not necessarily represent the official views of the National Institutes of Health. Funding was also provided by National Science Foundation grant NSF ECCS 1934991, NSF CMMI 1935181 and Cancer Center at Illinois (CCIL) seed grants to TS.
Footnotes
Publisher's Disclaimer: This is a PDF file of an unedited manuscript that has been accepted for publication. As a service to our customers we are providing this early version of the manuscript. The manuscript will undergo copyediting, typesetting, and review of the resulting proof before it is published in its final form. Please note that during the production process errors may be discovered which could affect the content, and all legal disclaimers that apply to the journal pertain.
Declaration of interests
The authors declare that they have no known competing financial interests or personal relationships that could have appeared to influence the work reported in this paper.
Competing interests
The authors declare that they have no competing interests.
Data and materials availability
All data needed to evaluate the conclusions in the paper are present in the paper and/or the Supplementary Information. Additional data related to this paper may be requested from the authors.
References
- [1].Vogel V, Sheetz MP, Mechanical Forces Matter in Health and Disease: From Cancer to Tissue Engineering, Nanotechnology (2010) 233–303. 10.1002/9783527628155.NANOTECH057. [DOI]
- [2].Emon B, Bauer J, Jain Y, Jung B, Saif T, Biophysics of Tumor Microenvironment and Cancer Metastasis - A Mini Review, Comput Struct Biotechnol J 16 (2018) 279–287. 10.1016/j.csbj.2018.07.003. [DOI] [PMC free article] [PubMed] [Google Scholar]
- [3].Bauer J, Emon MAB, Staudacher JJ, Thomas AL, Zessner-Spitzenberg J, Mancinelli G, Krett N, Saif MT, Jung B, Increased stiffness of the tumor microenvironment in colon cancer stimulates cancer associated fibroblast-mediated prometastatic activin A signaling, Sci Rep 10 (2020) 1–11. 10.1038/s41598-019-55687-6. [DOI] [PMC free article] [PubMed] [Google Scholar]
- [4].Previtera ML, Sengupta A, Substrate stiffness regulates proinflammatory mediator production through TLR4 activity in macrophages, PLoS One 10 (2015). 10.1371/journal.pone.0145813. [DOI] [PMC free article] [PubMed] [Google Scholar]
- [5].Bhowmick NA, Neilson EG, Moses HL, Stromal fibroblasts in cancer initiation and progression, Nature 432 (2004) 332–337. 10.1038/nature03096. [DOI] [PMC free article] [PubMed] [Google Scholar]
- [6].Alexander J, Cukierman E, Cancer associated fibroblast: Mediators of tumorigenesis, Matrix Biology 91–92 (2020) 19–34. 10.1016/j.matbio.2020.05.004. [DOI] [PMC free article] [PubMed] [Google Scholar]
- [7].Emon B, Song YJ, Joy MSH, Kovour MV, Prasanth KV, Saif MTA, Mechanosensitive changes in the expression of genes in colorectal cancer-associated fibroblasts, Scientific Data 2023 10:1 10 (2023) 1–6. 10.1038/s41597-023-02233-9. [DOI] [PMC free article] [PubMed] [Google Scholar]
- [8].Piccolo S, Dupont S, Cordenonsi M, The biology of YAP/TAZ: Hippo signaling and beyond, Physiol Rev 94 (2014) 1287–1312. 10.1152/PHYSREV.00005.2014/ASSET/IMAGES/LARGE/Z9J0041427080004.JPEG. [DOI] [PubMed] [Google Scholar]
- [9].Dupont S, Morsut L, Aragona M, Enzo E, Giulitti S, Cordenonsi M, Zanconato F, Le Digabel J, Forcato M, Bicciato S, Elvassore N, Piccolo S, Role of YAP/TAZ in mechanotransduction, Nature 2011 474:7350 474 (2011) 179–183. 10.1038/nature10137. [DOI] [PubMed] [Google Scholar]
- [10].Zanconato F, Cordenonsi M, Piccolo S, YAP/TAZ at the roots of cancer, Cancer Cell 29 (2016) 783. 10.1016/J.CCELL.2016.05.005. [DOI] [PMC free article] [PubMed] [Google Scholar]
- [11].Zmajkovicova K, Bauer Y, Menyhart K, Schnoebelen M, Freti D, Boucher M, Renault B, Studer R, Birker-Robaczewska M, Klenk A, Nayler O, Gatfield J, GPCR-induced YAP activation sensitizes fibroblasts to profibrotic activity of TGFβ1, PLoS One 15 (2020). 10.1371/JOURNAL.PONE.0228195. [DOI] [PMC free article] [PubMed] [Google Scholar]
- [12].Zhao B, Wei X, Li W, Udan RS, Yang Q, Kim J, Xie J, Ikenoue T, Yu J, Li L, Zheng P, Ye K, Chinnaiyan A, Halder G, Lai ZC, Guan KL, Inactivation of YAP oncoprotein by the Hippo pathway is involved in cell contact inhibition and tissue growth control, Genes Dev 21 (2007) 2747–2761. 10.1101/GAD.1602907. [DOI] [PMC free article] [PubMed] [Google Scholar]
- [13].Siew WC, Chun JL, Guo K, Chee PN, Lee I, Hunziker W, Zeng Q, Hong W, A role for TAZ in migration, invasion, and tumorigenesis of breast cancer cells, Cancer Res 68 (2008) 2592–2598. 10.1158/0008-5472.CAN-07-2696. [DOI] [PubMed] [Google Scholar]
- [14].Cheng H, Zhang Z, Rodriguez-Barrueco RR, Borczuk A, Liu H, Yu J, Silva JM, Cheng SK, Perez-Soler R, Halmos B, Functional genomics screen identifies YAP1 as a key determinant to enhance treatment sensitivity in lung cancer cells, Oncotarget 7 (2016) 28976–28988. 10.18632/ONCOTARGET.6721. [DOI] [PMC free article] [PubMed] [Google Scholar]
- [15].Ciamporcero E, Shen H, Ramakrishnan S, Yu Ku S, Chintala S, Shen L, Adelaiye R, Miles KM, Ullio C, Pizzimenti S, Daga M, Azabdaftari G, Attwood K, Johnson C, Zhang J, Barrera G, Pili R, YAP activation protects urothelial cell carcinoma from treatment-induced DNA damage, Oncogene 35 (2016) 1541–1553. 10.1038/ONC.2015.219. [DOI] [PMC free article] [PubMed] [Google Scholar]
- [16].Barbazán J, Matic Vignjevic D, Cancer associated fibroblasts: is the force the path to the dark side?, Curr Opin Cell Biol 56 (2019) 71–79. 10.1016/J.CEB.2018.09.002. [DOI] [PubMed] [Google Scholar]
- [17].Wada KI, Itoga K, Okano T, Yonemura S, Sasaki H, Hippo pathway regulation by cell morphology and stress fibers, Development 138 (2011) 3907–3914. 10.1242/DEV.070987. [DOI] [PubMed] [Google Scholar]
- [18].Halder G, Dupont S, Piccolo S, Transduction of mechanical and cytoskeletal cues by YAP and TAZ, Nature Reviews Molecular Cell Biology 2012 13:9 13 (2012) 591–600. 10.1038/nrm3416. [DOI] [PubMed] [Google Scholar]
- [19].Elosegui-Artola A, Andreu I, Beedle AEM, Lezamiz A, Uroz M, Kosmalska AJ, Oria R, Kechagia JZ, Rico-Lastres P, Le Roux AL, Shanahan CM, Trepat X, Navajas D, Garcia-Manyes S, Roca-Cusachs P, Force Triggers YAP Nuclear Entry by Regulating Transport across Nuclear Pores, Cell 171 (2017) 1397–1410.e14. 10.1016/J.CELL.2017.10.008. [DOI] [PubMed] [Google Scholar]
- [20].Scott KE, Fraley SI, Rangamani P, A spatial model of YAP/TAZ signaling reveals how stiffness, dimensionality, and shape contribute to emergent outcomes, Proc Natl Acad Sci U S A 118 (2021) e2021571118. 10.1073/PNAS.2021571118/SUPPL_FILE/PNAS.2021571118.SAPP.PDF. [DOI] [PMC free article] [PubMed] [Google Scholar]
- [21].Aragona M, Panciera T, Manfrin A, Giulitti S, Michielin F, Elvassore N, Dupont S, Piccolo S, A Mechanical Checkpoint Controls Multicellular Growth through YAP/TAZ Regulation by Actin-Processing Factors, Cell 154 (2013) 1047–1059. 10.1016/J.CELL.2013.07.042. [DOI] [PubMed] [Google Scholar]
- [22].Lee JY, Chang JK, Dominguez AA, pyo Lee H, Nam S, Chang J, Varma S, Qi LS, West RB, Chaudhuri O, YAP-independent mechanotransduction drives breast cancer progression, Nature Communications 2019 10:1 10 (2019) 1–9. 10.1038/s41467-019-09755-0. [DOI] [PMC free article] [PubMed] [Google Scholar]
- [23].Calvo F, Ege N, Grande-Garcia A, Hooper S, Jenkins RP, Chaudhry SI, Harrington K, Williamson P, Moeendarbary E, Charras G, Sahai E, Mechanotransduction and YAP-dependent matrix remodelling is required for the generation and maintenance of cancer-associated fibroblasts, Nat Cell Biol 15 (2013) 637–646. 10.1038/ncb2756. [DOI] [PMC free article] [PubMed] [Google Scholar]
- [24].Knoll SG, Ali MY, Saif MTA, A Novel Method for Localizing Reporter Fluorescent Beads Near the Cell Culture Surface for Traction Force Microscopy, Journal of Visualized Experiments (2014). 10.3791/51873. [DOI] [PMC free article] [PubMed]
- [25].Tse JR, Engler AJ, Preparation of Hydrogel Substrates with Tunable Mechanical Properties, Curr Protoc Cell Biol 47 (2010) 10.16.1–10.16.16. 10.1002/0471143030.cb1016s47. [DOI] [PubMed] [Google Scholar]
- [26].Corning Incorporated, Certificate of Analysis for Corning Collagen I High concentration (HC), Rat Tail, (n.d.). https://certs-ecatalog.corning.com/life-sciences/certs/354236/354236_6207007.pdf (accessed July 4, 2020).
- [27].Emon MAB, Knoll S, Doha U, Ladehoff L, Lalonde L, Baietto D, Sivaguru M, Bhargava R, Saif MTA, Dose-independent threshold illumination for non-invasive time-lapse fluorescence imaging of live cells, Extreme Mech Lett (2021) 101249. 10.1016/j.eml.2021.101249. [DOI] [PMC free article] [PubMed]
- [28].Emon B, Li Z, Joy MSH, Doha U, Kosari F, Saif MTA, A novel method for sensor-based quantification of single/multicellular force dynamics and stiffening in 3D matrices, Sci Adv 7 (2021) eabf2629. 10.1126/sciadv.abf2629. [DOI] [PMC free article] [PubMed] [Google Scholar]
- [29].Emon B, M Saddam H J, M Taher A S, Developing a multi-functional sensor for cell traction force, matrix remodeling and biomechanical assays in self-assembled 3D tissues in vitro, Protoc Exch (2021). 10.21203/RS.3.PEX-1540/V1. [DOI]
- [30].Elhebeary M, Emon MAB, Aydin O, Saif MTA, A novel technique for in situ uniaxial tests of self-assembled soft biomaterials, Lab Chip 19 (2019). 10.1039/c8lc01273c. [DOI] [PMC free article] [PubMed] [Google Scholar]
- [31].Legant WR, Pathak A, Yang MT, Deshpande VS, McMeeking RM, Chen CS, Microfabricated tissue gauges to measure and manipulate forces from 3D microtissues, Proceedings of the National Academy of Sciences 106 (2009) 10097–10102. 10.1073/pnas.0900174106. [DOI] [PMC free article] [PubMed] [Google Scholar]
- [32].Kawano S, Kojima M, Higuchi Y, Sugimoto M, Ikeda K, Sakuyama N, Takahashi S, Hayashi R, Ochiai A, Saito N, Assessment of elasticity of colorectal cancer tissue, clinical utility, pathological and phenotypical relevance, Cancer Sci 106 (2015) 1232–1239. 10.1111/cas.12720. [DOI] [PMC free article] [PubMed] [Google Scholar]
- [33].Basu S, Totty NF, Irwin MS, Sudol M, Downward J, Akt phosphorylates the Yes-associated protein, YAP, to induce interaction with 14-3-3 and attenuation of p73-mediated apoptosis, Mol Cell 11 (2003) 11–23. 10.1016/S1097-2765(02)00776-1. [DOI] [PubMed] [Google Scholar]
- [34].The heat of shortening and the dynamic constants of muscle, Proc R Soc Lond B Biol Sci 126 (1938) 136–195. 10.1098/RSPB.1938.0050. [DOI] [Google Scholar]
- [35].Hill TL, Eisenberg E, Chen YD, Podolsky RJ, Some self-consistent two-state sliding filament models of muscle contraction, Biophys J 15 (1975) 335–372. 10.1016/S0006-3495(75)85823-1. [DOI] [PMC free article] [PubMed] [Google Scholar]
- [36].Regazzoni F, Dedè L, Quarteroni A, Active Force Generation in Cardiac Muscle Cells: Mathematical Modeling and Numerical Simulation of the Actin-Myosin Interaction, Vietnam J Math 49 (2021) 87–118. 10.1007/S10013-020-00433-Z/FIGURES/10. [DOI] [PMC free article] [PubMed] [Google Scholar]
- [37].Zimmermann J, Brunner C, Enculescu M, Goegler M, Ehrlicher A, Käs J, Falcke M, Actin filament elasticity and retrograde flow shape the force-velocity relation of motile cells, Biophys J 102 (2012) 287–295. 10.1016/j.bpj.2011.12.023. [DOI] [PMC free article] [PubMed] [Google Scholar]
- [38].Fournier MF, Sauser R, Ambrosi D, Meister JJ, Verkhovsky AB, Force transmission in migrating cells, Journal of Cell Biology 188 (2010) 287–297. 10.1083/JCB.200906139/VIDEO-4. [DOI] [PMC free article] [PubMed] [Google Scholar]
- [39].Kim DH, Wirtz D, Focal adhesion size uniquely predicts cell migration, The FASEB Journal 27 (2013) 1351. 10.1096/FJ.12-220160. [DOI] [PMC free article] [PubMed] [Google Scholar]
- [40].Ribeiro AJS, Denisin AK, Wilson RE, Pruitt BL, For whom the cells pull: Hydrogel and micropost devices for measuring traction forces, Methods 94 (2016) 51–64. 10.1016/J.YMETH.2015.08.005. [DOI] [PMC free article] [PubMed] [Google Scholar]
- [41].Schoen I, Pruitt BL, Vogel V, The Yin-Yang of Rigidity Sensing: How Forces and Mechanical Properties Regulate the Cellular Response to Materials, 10.1146/Annurev-Matsci-062910-100407. 43 (2013) 589–618. . [DOI] [Google Scholar]
- [42].Han SJ, Bielawski KS, Ting LH, Rodriguez ML, Sniadecki NJ, Decoupling Substrate Stiffness, Spread Area, and Micropost Density: A Close Spatial Relationship between Traction Forces and Focal Adhesions, Biophys J 103 (2012) 640. 10.1016/J.BPJ.2012.07.023. [DOI] [PMC free article] [PubMed] [Google Scholar]
- [43].He S, Su Y, Ji B, Gao H, Some basic questions on mechanosensing in cell-substrate interaction, J Mech Phys Solids 70 (2014) 116–135. 10.1016/J.JMPS.2014.05.016. [DOI] [Google Scholar]
- [44].Janmey PA, Fletcher DA, Reinhart-King CA, Stiffness sensing by cells, Physiol Rev 100 (2020) 695–724. 10.1152/PHYSREV.00013.2019/ASSET/IMAGES/LARGE/Z9J0022029370017.JPEG. [DOI] [PMC free article] [PubMed] [Google Scholar]
- [45].Ghibaudo M, Saez A, Trichet L, Xayaphoummine A, Browaeys J, Silberzan P, Buguin A, Ladoux B, Traction forces and rigidity sensing regulate cell functions, Soft Matter 4 (2008) 1836–1843. 10.1039/B804103B. [DOI] [Google Scholar]
- [46].Swift J, Ivanovska IL, Buxboim A, Harada T, Dingal PCDP, Pinter J, Pajerowski JD, Spinler KR, Shin JW, Tewari M, Rehfeldt F, Speicher DW, Discher DE, Nuclear lamin-A scales with tissue stiffness and enhances matrix-directed differentiation, Science (1979) 341 (2013). 10.1126/SCIENCE.1240104/SUPPL_FILE/SWIFT.SM.PDF. [DOI] [PMC free article] [PubMed] [Google Scholar]
- [47].Glaubitz M, Block S, Witte J, Empen K, Gross S, Schlicht R, Weitmann K, Klingel K, Kandolf R, Hoffmann W, Gottschalk KE, Busch M, Dörr M, Helm CA, Felix SB, Riad A, Stiffness of left ventricular cardiac fibroblasts is associated with ventricular dilation in patients with recent-onset nonischemic and nonvalvular cardiomyopathy, Circulation Journal 78 (2014) 1693–1700. 10.1253/CIRCJ.CJ-13-1188. [DOI] [PubMed] [Google Scholar]
- [48].Peercy BE, Schneider MF, Mathematical modeling of nuclear trafficking of FOXO transcription factors, Methods in Molecular Biology 1890 (2019) 205–217. 10.1007/978-1-4939-8900-3_17/FIGURES/4. [DOI] [PMC free article] [PubMed] [Google Scholar]
- [49].Fischer RS, Myers KA, Gardel ML, Waterman CM, Stiffness-controlled three-dimensional extracellular matrices for high-resolution imaging of cell behavior, Nature Protocols 2012 7:11 7 (2012) 2056–2066. 10.1038/nprot.2012.127. [DOI] [PMC free article] [PubMed] [Google Scholar]
- [50].Mulligan JA, Bordeleau F, Reinhart-King CA, Adie SG, Traction Force Microscopy for Noninvasive Imaging of Cell Forces, in: Springer, Cham, 2018: pp. 319–349. 10.1007/978-3-319-95294-9_15. [DOI] [PMC free article] [PubMed] [Google Scholar]
- [51].Sabass B, Gardel ML, Waterman CM, Schwarz US, High Resolution Traction Force Microscopy Based on Experimental and Computational Advances, Biophys J 94 (2008) 207–220. 10.1529/BIOPHYSJ.107.113670. [DOI] [PMC free article] [PubMed] [Google Scholar]
- [52].Kim DH, Chambliss AB, Wirtz D, The multi-faceted role of the actin cap in cellular mechanosensation and mechanotransduction, Soft Matter 9 (2013) 5516. 10.1039/C3SM50798J. [DOI] [PMC free article] [PubMed] [Google Scholar]
- [53].Shiu JY, Aires L, Lin Z, Vogel V, Nanopillar force measurements reveal actin-cap-mediated YAP mechanotransduction, Nature Cell Biology 2017 20:3 20 (2018) 262–271. 10.1038/s41556-017-0030-y. [DOI] [PubMed] [Google Scholar]
- [54].Khatau SB, Hale CM, Stewart-Hutchinson PJ, Patel MS, Stewart CL, Searson PC, Hodzic D, Wirtz D, A perinuclear actin cap regulates nuclear shape, Proc Natl Acad Sci U S A 106 (2009) 19017–19022. 10.1073/PNAS.0908686106/SUPPL_FILE/SM10.MP4. [DOI] [PMC free article] [PubMed] [Google Scholar]
- [55].Moroishi T, Hansen CG, Guan KL, The emerging roles of YAP and TAZ in cancer, Nature Reviews Cancer 2015 15:2 15 (2015) 73–79. 10.1038/nrc3876. [DOI] [PMC free article] [PubMed] [Google Scholar]
- [56].Guilak F, Tedrow JR, Burgkart R, Viscoelastic Properties of the Cell Nucleus, Biochem Biophys Res Commun 269 (2000) 781–786. 10.1006/BBRC.2000.2360. [DOI] [PubMed] [Google Scholar]
- [57].Lo CM, Wang HB, Dembo M, Wang YL, Cell movement is guided by the rigidity of the substrate, Biophys J 79 (2000) 144–152. 10.1016/S0006-3495(00)76279-5. [DOI] [PMC free article] [PubMed] [Google Scholar]
- [58].Wang HB, Dembo M, Wang YL, Substrate flexibility regulates growth and apoptosis of normal but not transformed cells, Am J Physiol Cell Physiol 279 (2000) 1345–1350. 10.1152/AJPCELL.2000.279.5.C1345/ASSET/IMAGES/LARGE/H01100172003.JPEG. [DOI] [PubMed] [Google Scholar]
- [59].Califano JP, Reinhart-King CA, Substrate stiffness and cell area predict cellular traction stresses in single cells and cells in contact, Cell Mol Bioeng 3 (2010) 68–75. 10.1007/S12195-010-0102-6/FIGURES/7. [DOI] [PMC free article] [PubMed] [Google Scholar]
- [60].Zhao B, Li L, Lei Q, Guan K-L, The Hippo-YAP pathway in organ size control and tumorigenesis: an updated version, (n.d.). 10.1101/gad.1909210. [DOI] [PMC free article] [PubMed]
- [61].Porazinski S, Wang H, Asaoka Y, Behrndt M, Miyamoto T, Morita H, Hata S, Sasaki T, Krens SFG, Osada Y, Asaka S, Momoi A, Linton S, Miesfeld JB, Link BA, Senga T, Castillo-Morales A, Urrutia AO, Shimizu N, Nagase H, Matsuura S, Bagby S, Kondoh H, Nishina H, Heisenberg CP, Furutani-Seiki M, YAP is essential for tissue tension to ensure vertebrate 3D body shape, Nature 2015 521:7551 521 (2015) 217–221. 10.1038/nature14215. [DOI] [PMC free article] [PubMed] [Google Scholar]
- [62].Lachowski D, Cortes E, Robinson B, Rice A, Rombouts K, del Río Hernández AE, Lachowski D, Robinson E, Rice B, Rombouts A, Río Hernández D, FAK controls the mechanical activation of YAP, a transcriptional regulator required for durotaxis, The FASEB Journal 32 (2018) 1099–1107. 10.1096/FJ.201700721R. [DOI] [PubMed] [Google Scholar]
- [63].Caliari SR, Vega SL, Kwon M, Soulas EM, Burdick JA, Dimensionality and spreading influence MSC YAP/TAZ signaling in hydrogel environments, Biomaterials 103 (2016) 314–323. 10.1016/J.BIOMATERIALS.2016.06.061. [DOI] [PMC free article] [PubMed] [Google Scholar]
- [64].3D Cell Culture Gel, Col-Tgel for Tumor Cells, Stem Cells and primary cells – 101bio.com, (n.d.). https://www.101bio.com/P720_3D_cell_culture_gel.php (accessed October 5, 2023).
- [65].Samani A, Zubovits J, Plewes D, Elastic moduli of normal and pathological human breast tissues: An inversion-technique-based investigation of 169 samples, Phys Med Biol 52 (2007) 1565–1576. 10.1088/0031-9155/52/6/002. [DOI] [PubMed] [Google Scholar]
- [66].Conklin MW, Eickhoff JC, Riching KM, Pehlke CA, Eliceiri KW, Provenzano PP, Friedl A, Keely PJ, Aligned collagen is a prognostic signature for survival in human breast carcinoma, American Journal of Pathology 178 (2011) 1221–1232. 10.1016/j.ajpath.2010.11.076. [DOI] [PMC free article] [PubMed] [Google Scholar]
- [67].Case A, Brisson BK, Durham AC, Rosen S, Monslow J, Buza E, Salah P, Gillem J, Ruthel G, Veluvolu S, Kristiansen V, Puré E, Brown DC, Sørenmo KU, Volk SW, Identification of prognostic collagen signatures and potential therapeutic stromal targets in canine mammary gland carcinoma, PLoS One 12 (2017). 10.1371/journal.pone.0180448. [DOI] [PMC free article] [PubMed] [Google Scholar]
- [68].Drifka CR, Tod J, Loeffler AG, Liu Y, Thomas GJ, Eliceiri KW, Kao WJ, Periductal stromal collagen topology of pancreatic ductal adenocarcinoma differs from that of normal and chronic pancreatitis, Modern Pathology 2015 28:11 28 (2015) 1470–1480. 10.1038/modpathol.2015.97. [DOI] [PubMed] [Google Scholar]
- [69].Rubiano A, Delitto D, Han S, Gerber M, Galitz C, Trevino J, Thomas RM, Hughes SJ, Simmons CS, Viscoelastic properties of human pancreatic tumors and in vitro constructs to mimic mechanical properties, Acta Biomater 67 (2018) 331–340. 10.1016/J.ACTBIO.2017.11.037. [DOI] [PMC free article] [PubMed] [Google Scholar]
- [70].Kader A, Kaufmann JO, Mangarova DB, Moeckel J, Adams LC, Brangsch J, Heyl JL, Zhao J, Verlemann C, Karst U, Collettini F, Auer TA, Hamm B, Makowski MR, Collagen-Specific Molecular Magnetic Resonance Imaging of Prostate Cancer, Int J Mol Sci 24 (2023) 711. 10.3390/IJMS24010711. [DOI] [PMC free article] [PubMed] [Google Scholar]
- [71].Pei L, Liu Y, Liu L, Gao S, Gao X, Feng Y, Sun Z, Zhang Y, Wang C, Roles of cancer-associated fibroblasts (CAFs) in anti- PD-1/PD-L1 immunotherapy for solid cancers, Molecular Cancer 2023 22:1 22 (2023) 1–18. 10.1186/S12943-023-01731-Z. [DOI] [PMC free article] [PubMed] [Google Scholar]
- [72].Hargrove JL, Hulsey MG, Beale EG, The kinetics of mammalian gene expression, Bioessays 13 (1991) 667–674. 10.1002/BIES.950131209. [DOI] [PubMed] [Google Scholar]
- [73].Liu Y, Lu T, Zhang C, Xu J, Xue Z, Busuttil RW, Xu N, Xia Q, Kupiec-Weglinski JW, Ji H, Activation of YAP attenuates hepatic damage and fibrosis in liver ischemia-reperfusion injury, J Hepatol 71 (2019) 719–730. 10.1016/J.JHEP.2019.05.029. [DOI] [PMC free article] [PubMed] [Google Scholar]
- [74].Sun P, Zhang G, Su X, Jin C, Yu B, Yu X, Lv Z, Ma H, Zhang M, Wei W, Li W, Maintenance of Primary Hepatocyte Functions In Vitro by Inhibiting Mechanical Tension-Induced YAP Activation, Cell Rep 29 (2019) 3212–3222.e4. 10.1016/j.celrep.2019.10.128. [DOI] [PubMed] [Google Scholar]
- [75].Cai H, Xu Y, The role of LPA and YAP signaling in long-term migration of human ovarian cancer cells, Cell Communication and Signaling 11 (2013) 1–13. 10.1186/1478-811X-11-31/FIGURES/7. [DOI] [PMC free article] [PubMed] [Google Scholar]
- [76].Franklin JM, Ghosh RP, Shi Q, Reddick MP, Liphardt JT, Concerted localization-resets precede YAP-dependent transcription, Nature Communications 2020 11:1 11 (2020) 1–18. 10.1038/s41467-020-18368-x. [DOI] [PMC free article] [PubMed] [Google Scholar]
- [77].Koushki N, Ghagre A, Srivastava LK, Molter C, Ehrlicher AJ, Nuclear compression regulates YAP spatiotemporal fluctuations in living cells, Proc Natl Acad Sci U S A 120 (2023) e2301285120. 10.1073/PNAS.2301285120/SUPPL_FILE/PNAS.2301285120.SM02.AVI. [DOI] [PMC free article] [PubMed] [Google Scholar]
- [78].Meyer K, Lammers NC, Bugaj LJ, Garcia HG, Weiner OD, Decoding of YAP levels and dynamics by pluripotency factors, BioRxiv (2022) 2022.10.17.512504. 10.1101/2022.10.17.512504. [DOI]
- [79].Zanconato F, Battilana G, Cordenonsi M, Piccolo S, YAP/TAZ as therapeutic targets in cancer, Curr Opin Pharmacol 29 (2016) 26. 10.1016/J.COPH.2016.05.002. [DOI] [PMC free article] [PubMed] [Google Scholar]
- [80].V Pobbati A, Kumar R, Rubin BP, Hong W, Therapeutic targeting of TEAD transcription factors in cancer Biochemical Sciences, Trends Biochem Sci 48 (2023) 450–462. 10.1016/j.tibs.2022.12.005. [DOI] [PubMed] [Google Scholar]
Associated Data
This section collects any data citations, data availability statements, or supplementary materials included in this article.