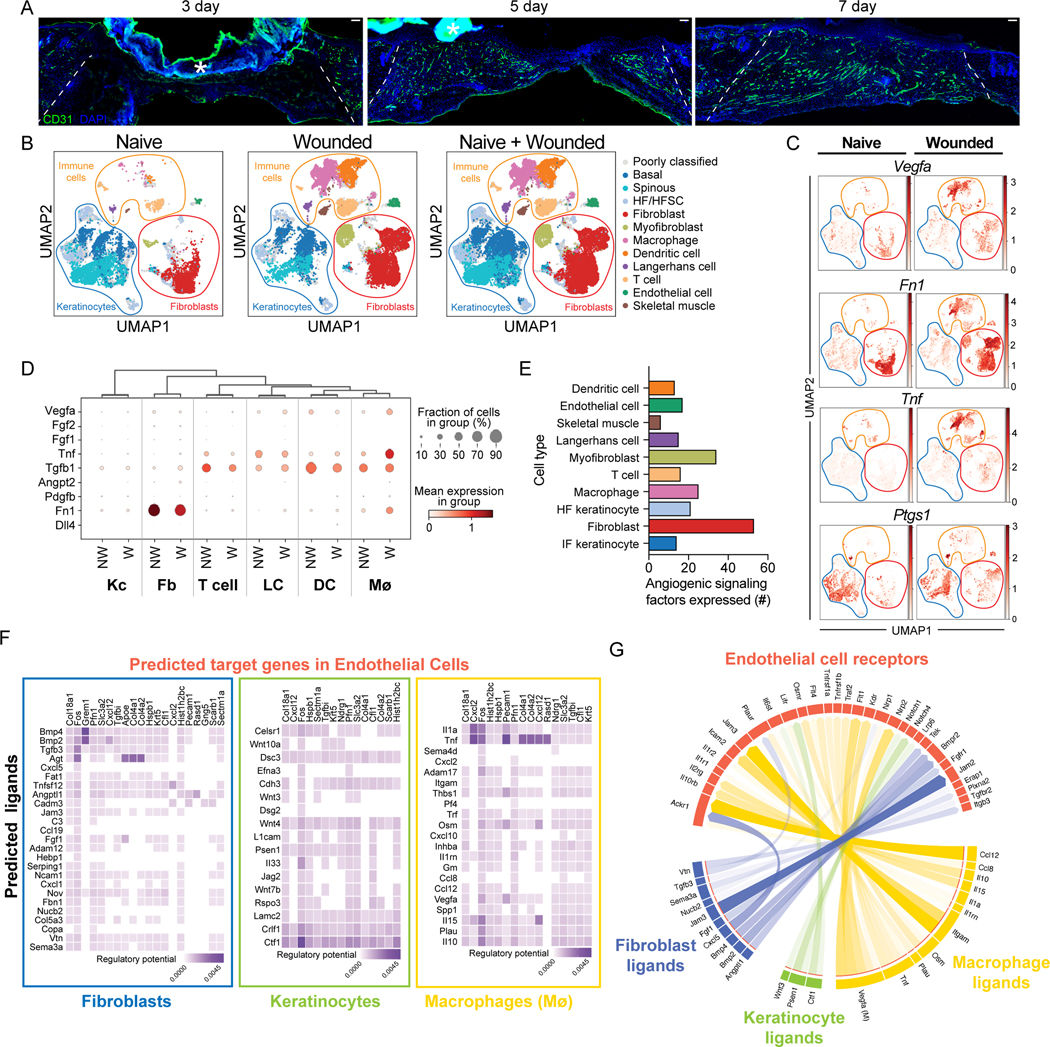
Figure 1: Identification of angiogenic regulators in skin wounds.
(A) Images of CD31 immunostaining (green) and DAPI-stained nuclei (blue) in cross-sections of 3-, 5-, and 7-day wound beds. The white dashed lines delineate wound edges. Asterisks (*) indicate non-specific staining of scab. Scale bars, 100 μm.
(B) Uniform Manifold Approximation and Projection (UMAP) plots of scRNA-seq data (Haensel et al. (GSE142471)) from mouse skin: non-wounded (Naive), 4-day Wounded, and combined.
(C) Feature plots showing expression of VEGFA, Tnf, Ptgs1, and Fn1 in single cells of Naive and Wounded skin from (B).
(D) Bubble plot depicting average mRNA expression (color) of angiogenic signaling factors expressed by single keratinocytes (Kc), fibroblasts (Fb), T cells, Langerhans cells, dendritic cells (DC), and macrophages (Mø) in wounded (W) and nonwounded (NW) samples from (B). Bubble size indicates the percent of cells expressing that gene.
(E) Quantification of the number of angiogenic signaling factors with an average mRNA expression level ≥1 in each indicated cell type.
(F) Heatmaps showing potential links between ligands expressed by Fb, Kc, and Mø and EC downstream target genes. Fibroblast data includes fibroblast and myofibroblast populations.Keratinocyte data includes basal, spinous, and HF/HFSC populations.
(G) Chord diagram summarizing the top 50 ligand-receptor links during wound healing. Arrows represent ligands from Fb, Kc, and Mø binding to EC receptors. See also Figures S1 and S2.

